

Roughly a fifth of the world’s daily oil moves through a channel 33 kilometers wide. Six months into a crisis that closed it, this report tracks what that leverage was worth — to Iran, to its neighbors, and to everyone downstream. The finding that runs through every section: holding a chokepoint and winning with it are not the same thing. Iran kept the corridor shut for six months and, by the numbers here, still comes out behind — while some of the parties least exposed to Hormuz came out ahead.
Days disrupted: 192 (since Feb 28, 2026) · Normal throughput: 20.9 mb/d (~34% of global crude, pre-war baseline) · Current traffic: ~6–12% of normal (6–13 vessels/day, 10-day average ~13), as of Sep 6 · Brent crude: $97+ (as of Sep 8, up from $91 in mid-August)
Executive summary
In February 2026, Iran closed the Strait of Hormuz and, for the first time, put a real price on the world’s most important energy chokepoint. This report traces what that leverage was actually worth: how much of the world’s oil and gas physically depends on the strait, why a shock there reaches economies that import almost none of that oil directly, how little of the flow can realistically be rerouted, how long importing countries can absorb the disruption before it forces their hand, why Washington keeps re-engaging despite minimal direct exposure, and — six months and two collapsed ceasefires later — what the closure has cost the country that started it.
Key findings
- The scale has no land-based substitute, and bypass capacity is unevenly held. Hormuz moves the equivalent of ten fully laden VLCC supertankers a day; bypass pipelines cover only 17–26% of that total flow, but the two countries that hold them, Saudi Arabia and the UAE, can reroute 41–83% and 66% of their own oil respectively — Iraq, Iran, and Kuwait have next to none.
- Exposure isn’t evenly distributed. Japan and South Korea depend on Hormuz for 54–92% of demand, while China and India are large customers but meaningfully diversified.
- Price shocks don’t respect import shares. Oil is priced on one global benchmark — countries that import almost no Gulf crude still absorb the same price shock as those that depend on it entirely.
- The negotiated peace has failed twice. A June 17 memorandum collapsed by mid-July, and a second, signed August 12, was already straining under a hardline domestic backlash in Tehran before September brought direct fire between Iranian and US forces.
- Iran’s own exposure is the least-told part of the story. A domestic gasoline shortfall, approximately $100B in frozen assets, a damaged relationship with its own mediator (Oman), and a full trade suspension by the UAE since August 19 — all accumulated while the strait was closed on Iran’s own order.
- Washington’s persistence has a cost too, rarely counted alongside Iran’s. Gulf partners say they had no seat at the table before the war began and are now hedging their defense relationships elsewhere; Iranian strikes on US bases have killed 18 American service members; and the Pentagon is reportedly weighing a reduced regional footprint. The credibility this report says motivates US involvement (Section 7) is also what that involvement has been spending.
- The region isn’t just tallying costs — it’s realigning, and not only regionally. Saudi Arabia and Turkey signed a NATO-style mutual defense pact with Pakistan in August, positioning Saudi Arabia as an emerging “centre of gravity” in its own right; Iran’s client network in Syria and Iraq keeps thinning while its own pivot toward Russia and China fails to land the backing it’s seeking; and most analysts credit China and Russia, not Iran, with this war’s clearest strategic gains — a verdict some extend to calling the US the biggest strategic loser, even as its own oil producers post a real income gain (Section 8).
- The closure hasn’t been costless for outsiders either — in the opposite direction. The two largest oil producers with no exposure to Hormuz, the US and Russia, have seen crude income rise an estimated 28–31% on higher prices alone.
- The conflict escalated directly for the first time on September 5, when Iran fired ballistic missiles at a US aircraft carrier and destroyer; both ships evaded the attack, and the US retaliated within hours by disabling or destroying three Iranian oil tankers. Iran responded on September 6 by declaring a unilateral “restricted maritime zone” near the strait.
How we got here
- Feb 28 — US–Israel strikes begin; Iran closes the strait within hours.
- Apr 8 — First ceasefire, collapses within ten days after a failed Islamabad round and a US naval blockade.
- Jun 17 — First MOU signed at Versailles (60-day toll-free passage); Iran’s own IRGC contradicts its Foreign Ministry within 48 hours.
- Jul 18 — First MOU formally void, after tanker strikes, a ~140-target CENTCOM strike package, and an Iranian strike on Oman, its own mediator.
- Aug 12 — Second MOU signed; Tehran hardliners call it “a strategic mistake” the same week.
- Aug 17 — The nuclear-talks window expires with no deal.
- Aug 19 — The UAE suspends all trade with Iran after missiles land near its territory; traffic has sat at ~12–15% of normal since.
- Sep 5 — Iran fires ballistic missiles at a US carrier and destroyer; both evade. The US retaliates within hours, disabling or destroying three Iranian oil tankers.
- Sep 6 — Iran declares a unilateral “restricted maritime zone” near the strait; Iran and Oman announce plans to sign new maps regulating Hormuz traffic.
This report in ten sections
- Section 1 — The Card Iran Holds. What the strait actually carries: the volumes, the crude/products split, and which exporters route through it.
- Section 2 — Volume Is One Thing, Dependence Another. Why the country that receives the most Hormuz oil isn’t necessarily the one most exposed to a closure.
- Section 3 — Why Everyone Pays. How the price shock reaches every economy on Earth at once, including ones with almost no Hormuz exposure at all.
- Section 4 — Can It Be Replaced? How much of the flow has a bypass route, and why the rest simply doesn’t.
- Section 5 — Gas Plays by Different Rules. Why LNG breaks almost every rule that governs the oil story, with its own separate winners and losers.
- Section 6 — The Clock Starts Ticking. How long each importer’s reserves buy before the pressure turns political rather than physical.
- Section 7 — Why Washington is Involved. Why the US has stayed this involved despite importing almost none of the oil at risk.
- Section 8 — The Cost of Holding the Card. What six months of closure has cost Iran, its neighbours, and the outside producers who’ve profited instead.
- Section 9 — The Card Iran Lost, and Who Picks It Up. Why the leverage is worth less in August than it was in February, even with the strait still shut.
- Section 10 — Closing Remarks: A Card Game With No Winners at the Table. Why the two actors who doubled down hardest, the US and Iran, both come out weaker — and what a hypothetical peace would and wouldn’t undo.
Section 1 — The Card Iran Holds
The Strait of Hormuz is 33 kilometers wide at its narrowest point. Through that gap, in normal times, flows roughly one-fifth of the world’s daily oil consumption — not a trickle but a sustained industrial torrent, averaging around 21 million barrels per day in 2022 before OPEC+ production cuts gradually brought it down to 20.9 million barrels per day in the first half of 2025, the equivalent of about ten fully laden VLCC supertankers passing through every single day (EIA World Oil Transit Chokepoints, Table 3, 1H2025). That is the scale of what Iran holds leverage over — and that headline number hides a split worth making explicit. The commonly cited figure of “20 million barrels per day” is petroleum liquids in total, not crude oil alone. Of that, approximately 14.7 million barrels per day is crude oil and condensate — the raw material refineries depend on for fuel, plastics, fertilizers, and thousands of industrial products. The remaining 6.1 million barrels per day is refined products (diesel, gasoline, jet fuel, fuel oil) already processed at Gulf refineries and moving outward to global markets. Alongside the oil, but counted separately, flows approximately 10 billion cubic feet of liquefied natural gas per day — roughly one-fifth of all global LNG trade, almost entirely from Qatar and the UAE (EIA, “About one-fifth of global LNG trade flows through the Strait of Hormuz,”. 2025) That gas lane is a separate story, but it operates through the same geographic bottleneck.
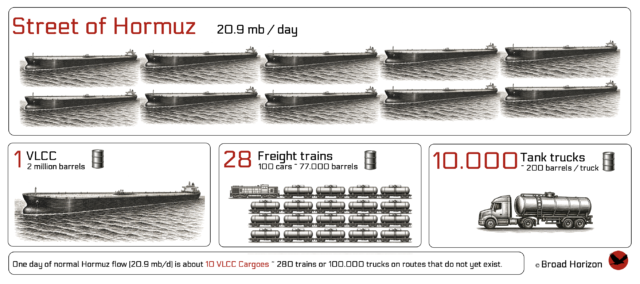
This is what makes Hormuz different from every other energy chokepoint on the map: it is simultaneously the world’s most important oil corridor, carrying approximately 34 percent of all globally traded crude (IEA Strait of Hormuz 2026 Factsheet), and a critical node in the global gas supply system. Close one narrow strait and you disrupt both. There is no land-based alternative that comes close to that throughput — not pipelines, not rail, not trucks. Existing bypass routes cover only a fraction of it; the scale itself is what explains the leverage Iran holds.
Hormuz throughput — 1H2025 vs 1Q2026 (Mb/d)
Petroleum liquids through the strait: first-half 2025 vs first-quarter 2026 (Mb/d).
{"labels":["1H2025","1Q2026"],"datasets":[{"label":"Crude Oil And Condensate","data":[14.7,10.7],"backgroundColor":"#BD0104FF","borderColor":"#BD0104FF","pointBackgroundColor":"#BD0104FF","pointBorderColor":"#ffffff"},{"label":"Total Petroleum Liquids","data":[20.9,14.6],"backgroundColor":"#BD0104E6","borderColor":"#BD0104E6","pointBackgroundColor":"#BD0104E6","pointBorderColor":"#ffffff"},{"label":"Petroleum products","data":[6.1,3.9],"backgroundColor":"#BD0104CC","borderColor":"#BD0104CC","pointBackgroundColor":"#BD0104CC","pointBorderColor":"#ffffff"}]}

Not every exporter feeding that flow depends on the strait equally, and that asymmetry matters throughout this report. Saudi Arabia moves the most — 6.23 million barrels per day through Hormuz in 2025 — followed by Iraq (3.63 mb/d), Kuwait (2.37 mb/d), Iran (2.41 mb/d), and Qatar (1.43 mb/d). Only Saudi Arabia and the UAE have any land-based alternative to the strait at all; Iraq, Kuwait, Qatar, and Iran effectively do not, a gap examined in full later. Oman is the exception that proves the rule: its exports leave from Gulf of Oman terminals and never touch Hormuz at all (Sources: IEA Strait of Hormuz 2026 Factsheet; EIA World Oil Transit Chokepoints).
Petroleum exports through Hormuz by country (Mb/d, 2025)
IEA Strait of Hormuz factsheet exporter volumes for 2025 (Mb/d).
{"labels":["Saudi Arabia","Iraq","UAE","Iran","Kuwait","Qatar","Neutral Zone","Bahrain"],"datasets":[{"label":"Mb\/d","data":[6.23,3.63,3.24,2.41,2.37,1.43,0.35,0.21],"backgroundColor":"#BD0104FF","borderColor":"#BD0104FF","pointBackgroundColor":"#BD0104FF","pointBorderColor":"#ffffff"}]}
Once it clears the strait, that oil doesn’t spread evenly either: eighty-nine percent of the crude and condensate leaving through Hormuz flows east, toward Asia. China (~38%), India (~15%), Japan (~11%), and South Korea (~12%) together account for 74 percent of all Hormuz crude flows. The United States takes roughly 2 percent; Europe roughly 4 percent (EIA, 1H2025).
Crude and condensate through Hormuz by destination (Mb/d, 2024–1H2025)
EIA destination volumes as a weighted 18-month Mb/d rate (calendar 2024 + 1H2025).
{"labels":["China","Other Asia & Oceania","India","South Korea","Japan","Europe","Other","United States","Saudi Arabia"],"datasets":[{"label":"Mb\/d","data":[5.085121378276927,2.197153413509243,1.9635838657025835,1.7930004716360233,1.7176653518501745,0.6934370128510903,0.5880217762179352,0.47478271088568863,0.1623599797321096],"backgroundColor":"#BD0104FF","borderColor":"#BD0104FF","pointBackgroundColor":"#BD0104FF","pointBorderColor":"#ffffff"}]}
That destination pattern is easy to over-read: receiving the most Hormuz oil, as China does, isn’t the same thing as being the most dependent on it. The gap between those two ideas is wide enough to change which countries are actually most exposed.
To get a complete picture of the flow see the Sankey Diagram below:
Reading Tip: Iran’s Retaliation in Cold War Mode — Broad Horizon’s own look at the asymmetric-cost logic behind Iran’s strategy, with Hormuz as the central leverage point.
Section 2 — Volume Is One Thing, Dependence Another
China receives approximately 38 percent of all oil transiting Hormuz — the single largest share of any country — and that number alone is enough to make China look like the most exposed economy in this crisis. It’s accurate. It’s also misleading, because it answers the wrong question.
China is also Iran’s largest oil customer. If Beijing ran short, it would have its own reason to lean on Tehran to reopen the strait — a second superpower’s pressure stacked on Washington’s.
The right question is not who receives the most Hormuz oil. It is whose total energy supply — every barrel burned, consumed, and processed across the entire economy — would be most disrupted if the strait remained closed for months. That requires a different calculation, and it produces a substantially different picture.
Getting that calculation right means keeping three metrics strictly separate — conflating them is the most common analytical error in public coverage of this crisis, and two of them are close enough in size to look like a typo when they’re actually not the same question at all. Transit share asks: of all the oil passing through Hormuz, what share goes to this country? China’s figure is 37.7 percent — that tells you who the corridor’s biggest customer is, and nothing about how dependent that customer is. Import share asks a different question: of this country’s own total crude imports, what share arrives via Hormuz? For China, that’s approximately 36 percent, since Gulf producers account for about 36 percent of China’s crude imports and the rest arrives from Russia, Brazil, Angola, and sanctioned Iranian production rebranded at Malaysian ports (Columbia University CGEP, 2026). Those two numbers, 37.7 percent and 36 percent, are not two attempts at the same fact, and there’s no gap between them to explain — they’re percentages of two completely different totals (everything Hormuz carries, versus everything China buys), so they can’t be compared or netted against each other at all. They just happen to both fall in the mid-30s for these two countries; for a different pair of numbers, they might not be anywhere close. Demand share is the one that actually matters for this report: what percentage of a country’s total energy consumption is linked to Hormuz. China imports roughly 78 percent of its petroleum needs, and multiplying that by the Hormuz share of imports gives approximately 28 percent of China’s total oil demand — not 38 percent, and not 36 percent either (EIA strategic inventories, April 2026). That 78 percent already nets out China’s own oil production — it isn’t a separate factor this framework ignores. China pumped a record 216 million tonnes domestically in 2025, roughly 4.3 million barrels a day, which is exactly why its import share sits well below 100 percent to begin with (China Daily, citing state data, 2026). The same accounting runs under every number in the table below: a low demand-share figure can reflect diversified sourcing, real domestic production, or both, and the two aren’t always distinguishable from the headline percentage alone.
China — suppliers (Mb/d)
{"labels":["Russian Federation","Saudi Arabia","Malaysia","Iran","Iraq","Oman","Brazil","United Arab Emirates","Angola","Kuwait","Qatar","United States"],"datasets":[{"label":"Mb\/d","data":[2.17830008,1.5792157459452054,1.4089135583561645,1.384,1.2820081638356164,0.8187083846575341,0.7397801495890411,0.713566061369863,0.5767904704109589,0.3207140084931506,0.2043887962191781,0.19357991797260274],"backgroundColor":"#BD0104FF","borderColor":"#BD0104FF","pointBackgroundColor":"#BD0104FF","pointBorderColor":"#ffffff"}]}
China — import / domestic (Mb/d)
{"labels":["Domestic","Import"],"datasets":[{"label":"Mb\/d","data":[4.2546968000000005,11.06871008333333],"backgroundColor":"#BD0104FF","borderColor":"#BD0104FF","pointBackgroundColor":"#BD0104FF","pointBorderColor":"#ffffff"}]}
That distinction is the difference between a crisis that requires immediate rationing and one that requires sustained management over months. China’s 85 days of combined strategic and commercial stocks (assumed stock) – cover its entire oil consumption, not just the Hormuz-linked 28 percent of it — so losing that share entirely, with no substitution at all, would take considerably longer than 85 days to actually exhaust the stockpile, not less. Section 6 works through exactly how much longer, starting from this same 85-day figure; the point here is narrower: at 28 percent demand exposure, China faces a pressure-accumulation problem measured in months, not an instant fuel emergency.
China’s own numbers show the strain behind that pressure-accumulation picture: crude imports down from around 11 million barrels a day before the war to about 7.8 million by May 2026, a decade low, with strategic reserves drawn down by roughly 1.4 billion barrels over the same period (Fortune, June 2026, citing Oxford Institute for Energy Studies). Beijing hasn’t stayed passive about it, either — in April 2026, Foreign Minister Wang Yi pressed his Iranian counterpart directly on reopening the strait, in the same period that Chinese-flagged tankers were being turned back by the US naval blockade (Newsweek, April 2026).
| Country | Share of Hormuz transit | Hormuz share of imports | Hormuz share of demand |
|---|---|---|---|
| China | 37.7% | ~36% | ~28% |
| India | 14.7% | ~30% (conflict-era; was ~45%) | ~26% |
| Japan | 10.9% | ~95% | ~92% |
| South Korea | 12.0% | ~56% (down from ~69% Middle East) | ~54% |
| United States | 2.5% | ~7% | ~2% |
| Europe (EU) | 3.8% | ~8–15% | ~7–13% |
(Sources: EIA, transit; Columbia CGEP, India-Briefing, S&P Global/METI, Korea Herald, import shares; EIA, demand-basis calculations)
China and India are large consumers of Hormuz oil but diversified enough — through Russian pipelines, Atlantic-basin suppliers, and shadow trade — to have meaningful alternatives. Japan and South Korea have almost none. Japan sources approximately 95 percent of its crude from Middle Eastern suppliers, essentially all of it transiting Hormuz, and its refiners are specifically configured for the medium sour grades those suppliers produce — switching to Atlantic-basin light sweet crude means blending adjustments, yield losses, and refinery modifications that take months (S&P Global/METI, August 2025). That structural inertia is real, but it is easing faster than the refinery math alone would suggest: US crude exports to Japan averaged 105,000 barrels a day in Jan–May 2025 and 507,000 in the same months of 2026 — a nearly fivefold rise, still a small share of Japan’s total needs, but a genuine and fast-moving shift in the mix (EIA, destination-level crude export data, released 31 Jul 2026).
Japan — suppliers (Mb/d)
{"labels":["United Arab Emirates","Saudi Arabia","Kuwait","Qatar","United States","Ecuador","Oman","Australia","South Sudan","Brunei Darussalam","Colombia","Malaysia"],"datasets":[{"label":"Mb\/d","data":[0.9866077580821917,0.919421781369863,0.14867258260273972,0.09759692169863014,0.08575889940273973,0.029462543397260274,0.023312410320547945,0.005835742347945206,0.005732210616438356,0.0041237877123287674,0.002288570591780822,0.0016885950301369862],"backgroundColor":"#BD0104FF","borderColor":"#BD0104FF","pointBackgroundColor":"#BD0104FF","pointBorderColor":"#ffffff"}]}
Japan — import / domestic (Mb/d)
{"labels":["Import","Domestic"],"datasets":[{"label":"Mb\/d","data":[2.332086166666667,0.00314275],"backgroundColor":"#BD0104FF","borderColor":"#BD0104FF","pointBackgroundColor":"#BD0104FF","pointBorderColor":"#ffffff"}]}
South Korea moved faster: before the conflict it sourced about 69 percent of its crude from the Middle East, almost all via Hormuz; by April 2026 that had dropped to 56 percent, with Saudi and UAE barrels arriving via Yanbu instead and new volumes secured from Algeria, Brazil, Ecuador, Kazakhstan, and the US (Korea Herald, April 2026). The rerouting is real, but partial — harder-to-replace volumes like Iraqi heavy crude still require the strait.
South Korea — suppliers (Mb/d)
{"labels":["Saudi Arabia","United States","Iraq","United Arab Emirates","Kuwait","Qatar","Brazil","Mexico","Australia","Kazakhstan","Algeria","Canada"],"datasets":[{"label":"Mb\/d","data":[0.9465127955427863,0.4481825157654808,0.3112596486782192,0.3083345230775507,0.2395957954821387,0.10986922044791782,0.08677259117745753,0.07416662987629405,0.0559412135111315,0.03885143432312329,0.03651623507098631,0.013332729548054792],"backgroundColor":"#BD0104FF","borderColor":"#BD0104FF","pointBackgroundColor":"#BD0104FF","pointBorderColor":"#ffffff"}]}
South Korea — import / domestic (Mb/d)
{"labels":["Domestic","Import"],"datasets":[{"label":"Mb\/d","data":[0,2.7598151749999995],"backgroundColor":"#BD0104FF","borderColor":"#BD0104FF","pointBackgroundColor":"#BD0104FF","pointBorderColor":"#ffffff"}]}
Of that group, India is the most instructive case, because it adapted fastest and most visibly. Before the conflict, approximately 45 percent of India’s crude imports transited Hormuz; by March 2026 that had dropped to around 30 percent, achieved mainly by expanding Russian purchases (already the largest single supplier at 30 percent), lifting US volumes 64 percent year-on-year, and growing Atlantic-basin purchases from Nigeria, Angola, and Brazil (India-Briefing/Department of Commerce India, April 2026). It wasn’t free: LPG, which is harder to reroute than crude, forced India to invoke the Essential Commodities Act, run refineries above rated capacity, and ration commercial gas users to protect households. India cut its Hormuz exposure by a third within weeks. Japan, by contrast, faces a multi-year structural adjustment.
India — suppliers (Mb/d)
{"labels":["Russian Federation","Iraq","Saudi Arabia","United Arab Emirates","United States","Kuwait","Nigeria","Angola","Canada","Brazil","Colombia","Qatar"],"datasets":[{"label":"Mb\/d","data":[1.7817557988843837,1.0068133079994248,0.7401963141345754,0.5352916802106028,0.27073524752758904,0.1651290852739726,0.15039897081164383,0.11172912157441096,0.08531100676142465,0.07035240083621919,0.06805697364194521,0.055785778328767126],"backgroundColor":"#BD0104FF","borderColor":"#BD0104FF","pointBackgroundColor":"#BD0104FF","pointBorderColor":"#ffffff"}]}
India — import / domestic (Mb/d)
{"labels":["Import","Domestic"],"datasets":[{"label":"Mb\/d","data":[4.782068425,0.5874518833333333],"backgroundColor":"#BD0104FF","borderColor":"#BD0104FF","pointBackgroundColor":"#BD0104FF","pointBorderColor":"#ffffff"}]}
Four tiers emerge from this evidence. Japan and South Korea face the highest physical risk, given their refinery configurations and lack of alternative sources. India and China face serious but manageable exposure, cushioned by diversified supply and — for China — large strategic stocks. Europe and the US are primarily affected through the global price mechanism rather than physical supply constraints, since a shock centered on Asian importers still reprices oil for everyone. The US case specifically isn’t a diversification story the way India’s is — it’s a production one. America now pumps more crude than any Gulf state, a net importer of only about 2.2 million barrels a day against consumption above 20 million, and that domestic output, not clever sourcing, is the main reason its Hormuz-linked demand share sits at just 2 percent (Pew Research Center, July 2026, citing EIA). Europe’s low demand share is the opposite case — genuine diversification away from a Gulf-heavy mix, not domestic production it doesn’t have.
United States — suppliers (Mb/d)
{"labels":["Canada","Mexico","Saudi Arabia","Brazil","Colombia","Guyana","Iraq","\u2014","Nigeria","Ecuador","Argentina","United Kingdom"],"datasets":[{"label":"Mb\/d","data":[4.549017488120384,0.4388436183303288,0.3101389302159452,0.2280003405060822,0.22091728439046573,0.22027190457969864,0.20857487087761645,0.16342208844953424,0.15745151974841096,0.11754983424936986,0.11558482628482192,0.05918323395131507],"backgroundColor":"#BD0104FF","borderColor":"#BD0104FF","pointBackgroundColor":"#BD0104FF","pointBorderColor":"#ffffff"}]}
United States — import / domestic (Mb/d)
{"labels":["Import","Domestic"],"datasets":[{"label":"Mb\/d","data":[6.587749558333332,13.208651266666667],"backgroundColor":"#BD0104FF","borderColor":"#BD0104FF","pointBackgroundColor":"#BD0104FF","pointBorderColor":"#ffffff"}]}
Reserve coverage is what eventually converts these exposure percentages into time — a country 28 percent dependent with 85 days of reserves faces a very different calculus than one 92 percent dependent with 138 days. But time isn’t the first thing a Hormuz closure changes. Price is, and it changes for every country at once, on the same day, regardless of exposure tier — including the ones just shown to have almost no physical exposure at all.
Section 3 — Why Everyone Pays
Hormuz carries about 34 percent of the world’s traded crude — which means the other 66 percent moves through routes that never come near the strait at all: the Cape of Good Hope, the US Gulf Coast, the North Sea, West Africa, Russia’s Far East terminals. None of that oil is physically at risk when Iran closes the strait. Almost all of it still got more expensive anyway, for the same reason a country that receives 2 percent of its oil through Hormuz does not experience a 2 percent price increase when the strait closes. It experiences roughly the same price shock as a country that receives 50 percent. That is not an accident of global markets — it is how they are designed to work, and understanding it is essential to understanding why Washington’s response to this crisis is not irrational, even though its direct physical exposure is minimal.
Here’s how: oil is priced globally, through benchmark contracts and futures markets that synchronize price signals across every major economy almost simultaneously. The dominant benchmark is Brent crude; most long-term supply contracts anywhere in the world are priced as a discount or premium to it. Brent is set not by what oil costs today but by what the market expects it to cost in coming months — the moment a credible threat to supply emerges, traders reprice the probability of shortage across all forward contracts before a single physical barrel has moved.
When the conflict around Hormuz escalated in early 2026, Brent climbed from $69 per barrel in mid-June 2025 to a peak of $118 per barrel by March 2026 (EIA Today in Energy). A German plastics manufacturer, a French fertilizer producer, and an American airline all paid more for energy and feedstocks — not because any of them import Gulf crude directly, but because the market they buy from had repriced global supply risk.
That $69→$118 arc was the opening act, not the whole story. Futures pulled back into the $90s over the summer as the market priced in two negotiated ceasefires — but the physical, or “dated,” price (what a refiner actually pays for a barrel loading today, versus one promised for next month) spiked far higher and separated from futures entirely: at points in August, dated Brent traded near $132 against a futures price closer to $97, a $35 gap reflecting genuine scarcity in Asian and Middle Eastern spot markets rather than speculation (SolAbility, Aug 2026). By August 19, with both ceasefires stalled and no new attack driving it, Brent futures were back above $91 — their highest level since July 30 — on the diplomatic freeze alone (Global Energy Flow, 19 Aug 2026). Six months on, the lesson isn’t the height of the March spike; it’s that the market still hasn’t found a floor.
Brent spot — crisis window
{"labels":["2025 06 02","2025 06 03","2025 06 04","2025 06 05","2025 06 06","2025 06 09","2025 06 10","2025 06 11","2025 06 12","2025 06 13","2025 06 16","2025 06 17","2025 06 18","2025 06 19","2025 06 20","2025 06 23","2025 06 24","2025 06 25","2025 06 26","2025 06 27","2025 06 30","2025 07 01","2025 07 02","2025 07 03","2025 07 04","2025 07 07","2025 07 08","2025 07 09","2025 07 10","2025 07 11","2025 07 14","2025 07 15","2025 07 16","2025 07 17","2025 07 18","2025 07 21","2025 07 22","2025 07 23","2025 07 24","2025 07 25","2025 07 28","2025 07 29","2025 07 30","2025 07 31","2025 08 01","2025 08 04","2025 08 05","2025 08 06","2025 08 07","2025 08 08","2025 08 11","2025 08 12","2025 08 13","2025 08 14","2025 08 15","2025 08 18","2025 08 19","2025 08 20","2025 08 21","2025 08 22","2025 08 26","2025 08 27","2025 08 28","2025 08 29","2025 09 01","2025 09 02","2025 09 03","2025 09 04","2025 09 05","2025 09 08","2025 09 09","2025 09 10","2025 09 11","2025 09 12","2025 09 15","2025 09 16","2025 09 17","2025 09 18","2025 09 19","2025 09 22","2025 09 23","2025 09 24","2025 09 25","2025 09 26","2025 09 29","2025 09 30","2025 10 01","2025 10 02","2025 10 03","2025 10 06","2025 10 07","2025 10 08","2025 10 09","2025 10 10","2025 10 13","2025 10 14","2025 10 15","2025 10 16","2025 10 17","2025 10 20","2025 10 21","2025 10 22","2025 10 23","2025 10 24","2025 10 27","2025 10 28","2025 10 29","2025 10 30","2025 10 31","2025 11 03","2025 11 04","2025 11 05","2025 11 06","2025 11 07","2025 11 10","2025 11 11","2025 11 12","2025 11 13","2025 11 14","2025 11 17","2025 11 18","2025 11 19","2025 11 20","2025 11 21","2025 11 24","2025 11 25","2025 11 26","2025 11 27","2025 11 28","2025 12 01","2025 12 02","2025 12 03","2025 12 04","2025 12 05","2025 12 08","2025 12 09","2025 12 10","2025 12 11","2025 12 12","2025 12 15","2025 12 16","2025 12 17","2025 12 18","2025 12 19","2025 12 22","2025 12 23","2025 12 24","2025 12 29","2025 12 30","2025 12 31","2026 01 02","2026 01 05","2026 01 06","2026 01 07","2026 01 08","2026 01 09","2026 01 12","2026 01 13","2026 01 14","2026 01 15","2026 01 16","2026 01 19","2026 01 20","2026 01 21","2026 01 22","2026 01 23","2026 01 26","2026 01 27","2026 01 28","2026 01 29","2026 01 30","2026 02 02","2026 02 03","2026 02 04","2026 02 05","2026 02 06","2026 02 09","2026 02 10","2026 02 11","2026 02 12","2026 02 13","2026 02 16","2026 02 17","2026 02 18","2026 02 19","2026 02 20","2026 02 23","2026 02 24","2026 02 25","2026 02 26","2026 02 27","2026 03 02","2026 03 03","2026 03 04","2026 03 05","2026 03 06","2026 03 09","2026 03 10","2026 03 11","2026 03 12","2026 03 13","2026 03 16","2026 03 17","2026 03 18","2026 03 19","2026 03 20","2026 03 23","2026 03 24","2026 03 25","2026 03 26","2026 03 27","2026 03 30","2026 03 31","2026 04 01","2026 04 02","2026 04 07","2026 04 08","2026 04 09","2026 04 10","2026 04 13","2026 04 14","2026 04 15","2026 04 16","2026 04 17","2026 04 20","2026 04 21","2026 04 22","2026 04 23","2026 04 24","2026 04 27","2026 04 28","2026 04 29","2026 04 30","2026 05 01","2026 05 05","2026 05 06","2026 05 07","2026 05 08","2026 05 11","2026 05 12","2026 05 13","2026 05 14","2026 05 15","2026 05 18","2026 05 19","2026 05 20","2026 05 21","2026 05 22","2026 05 26","2026 05 27","2026 05 28","2026 05 29","2026 06 01","2026 06 02","2026 06 03","2026 06 04","2026 06 05","2026 06 08","2026 06 09","2026 06 10","2026 06 11","2026 06 12","2026 06 15","2026 06 16","2026 06 17","2026 06 18","2026 06 19","2026 06 22","2026 06 23","2026 06 24","2026 06 25","2026 06 26","2026 06 29","2026 06 30","2026 07 01","2026 07 02","2026 07 03","2026 07 06","2026 07 07","2026 07 08","2026 07 09","2026 07 10","2026 07 13","2026 07 14","2026 07 15","2026 07 16","2026 07 17","2026 07 20","2026 07 21","2026 07 22","2026 07 23","2026 07 24","2026 07 27","2026 07 28","2026 07 29","2026 07 30","2026 07 31","2026 08 03","2026 08 04","2026 08 05","2026 08 06","2026 08 07","2026 08 10","2026 08 11","2026 08 12","2026 08 13","2026 08 14","2026 08 17","2026 08 18","2026 08 19","2026 08 20","2026 08 21","2026 08 24","2026 08 25","2026 08 26","2026 08 27","2026 08 28","2026 09 01"],"datasets":[{"label":"USD\/bbl","data":[66.55,67.48,66.69,67.14,68.02,68.73,68.41,71.29,70.84,76,75.05,78.7,78.38,80.37,78.73,74.34,69.13,68.4,68.57,69.37,68.15,67.63,70.8,70.42,71.03,71.95,72.5,71.98,70.38,72.06,70.96,70.27,69.67,71.32,71.06,71.92,69.69,69.17,70.42,69.23,70.87,73.21,73.98,73.43,70.55,69.56,69.14,67.97,66.99,67.17,67.36,66.8,66.25,68.12,67.3,68.18,66.62,67.61,68.41,68.29,66.89,67.75,68.61,67.83,67.09,68.09,67.76,66.41,64.92,65.44,67.97,67.62,67.25,67.87,67.88,69.69,69.19,67.83,67.05,66.87,67.96,69.64,70.48,71.15,69,68.52,66.67,65.44,66.13,67.09,67.1,67.42,67.23,64.41,64.15,63,62.33,61.08,61.23,60.71,61,62.28,66.32,65.8,65.52,64.03,65.01,65.11,65.44,65.79,65.04,63.54,63.41,63.72,63.01,63.86,61.88,62.14,63.45,63.16,64.86,63.78,63.64,62.78,64.83,63.99,64.81,64.18,64.07,64.22,63.37,63.75,64.15,64.42,63.3,62.62,63.12,61.87,62.11,61.55,59.93,60.61,60.69,61.35,62.22,63.7,63.7,63.1,62.3,61.35,61.98,63,62.1,61.08,63.34,65.11,65.4,67.58,68.87,66.16,66.97,66.91,67.68,66.72,65.46,68.16,67.7,70.28,70.9,71,72.25,67.72,70.01,71.15,69.87,70.45,71.19,71.01,71.52,69.8,69.96,70.81,69.77,71.78,73.17,72.75,71.9,71.21,70.69,71.66,71.32,77.24,83.28,81.56,88.59,95.74,94.35,89.84,90.98,102.38,103.23,101.04,108.39,118.09,111.05,118.42,103.79,108.42,109.14,113.39,121.47,121.88,126.69,119.56,127.61,138.21,122.11,119.03,119.07,123.28,118.69,114.93,116.63,98.63,103.4,106.14,113.44,113.25,111.86,113.89,117.62,124.16,124.24,118.26,114.51,103.7,101.82,103.48,106.11,111.37,110.28,110.91,113.96,116.73,114.64,108.93,105.84,106.9,102.75,97.11,95.47,92.88,98.29,98.49,101.69,98.98,97.29,97.46,94.15,95.73,92.84,88.64,84.36,80.5,80.33,79.35,80.46,76.49,75.69,72.09,73.74,70.16,71.59,70.46,69.24,68.53,68.68,69.56,71.78,76.5,74.46,74.34,81.62,83.69,83.08,81.23,85.01,86.99,93.85,94.12,105.32,100.31,91.82,85.51,91.95,91.91,96.95,88.9,86.47,86.65,89.65,87.62,92.74,93.26,92.52,92.03,92.02,92.43,95.29,92.37,94,96.92,92.71,88.24,87.77,90.18,89.75,96.02],"backgroundColor":"#3B6F8FCC","borderColor":"#3B6F8F","pointBackgroundColor":"#3B6F8F","pointBorderColor":"#ffffff"}]}
Beneath that headline price sits a faster-moving cascade. When the risk of attack on tankers rises, maritime war-risk insurance premiums spike, get passed from charterers to refiners to consumers, and during acute tension can multiply several times over within days. Higher freight and insurance costs push some vessels to reroute around the Cape of Good Hope, adding weeks to transit times and absorbing tanker capacity that would otherwise serve other routes — so effective global supply falls not because less oil is produced, but because it takes longer to arrive. Refiners then compete more aggressively for available barrels, industrial hedgers see their futures contracts move against them, and governments calculate reserve drawdowns against rapidly moving price targets. A geographically specific disruption becomes a global financial event within hours.
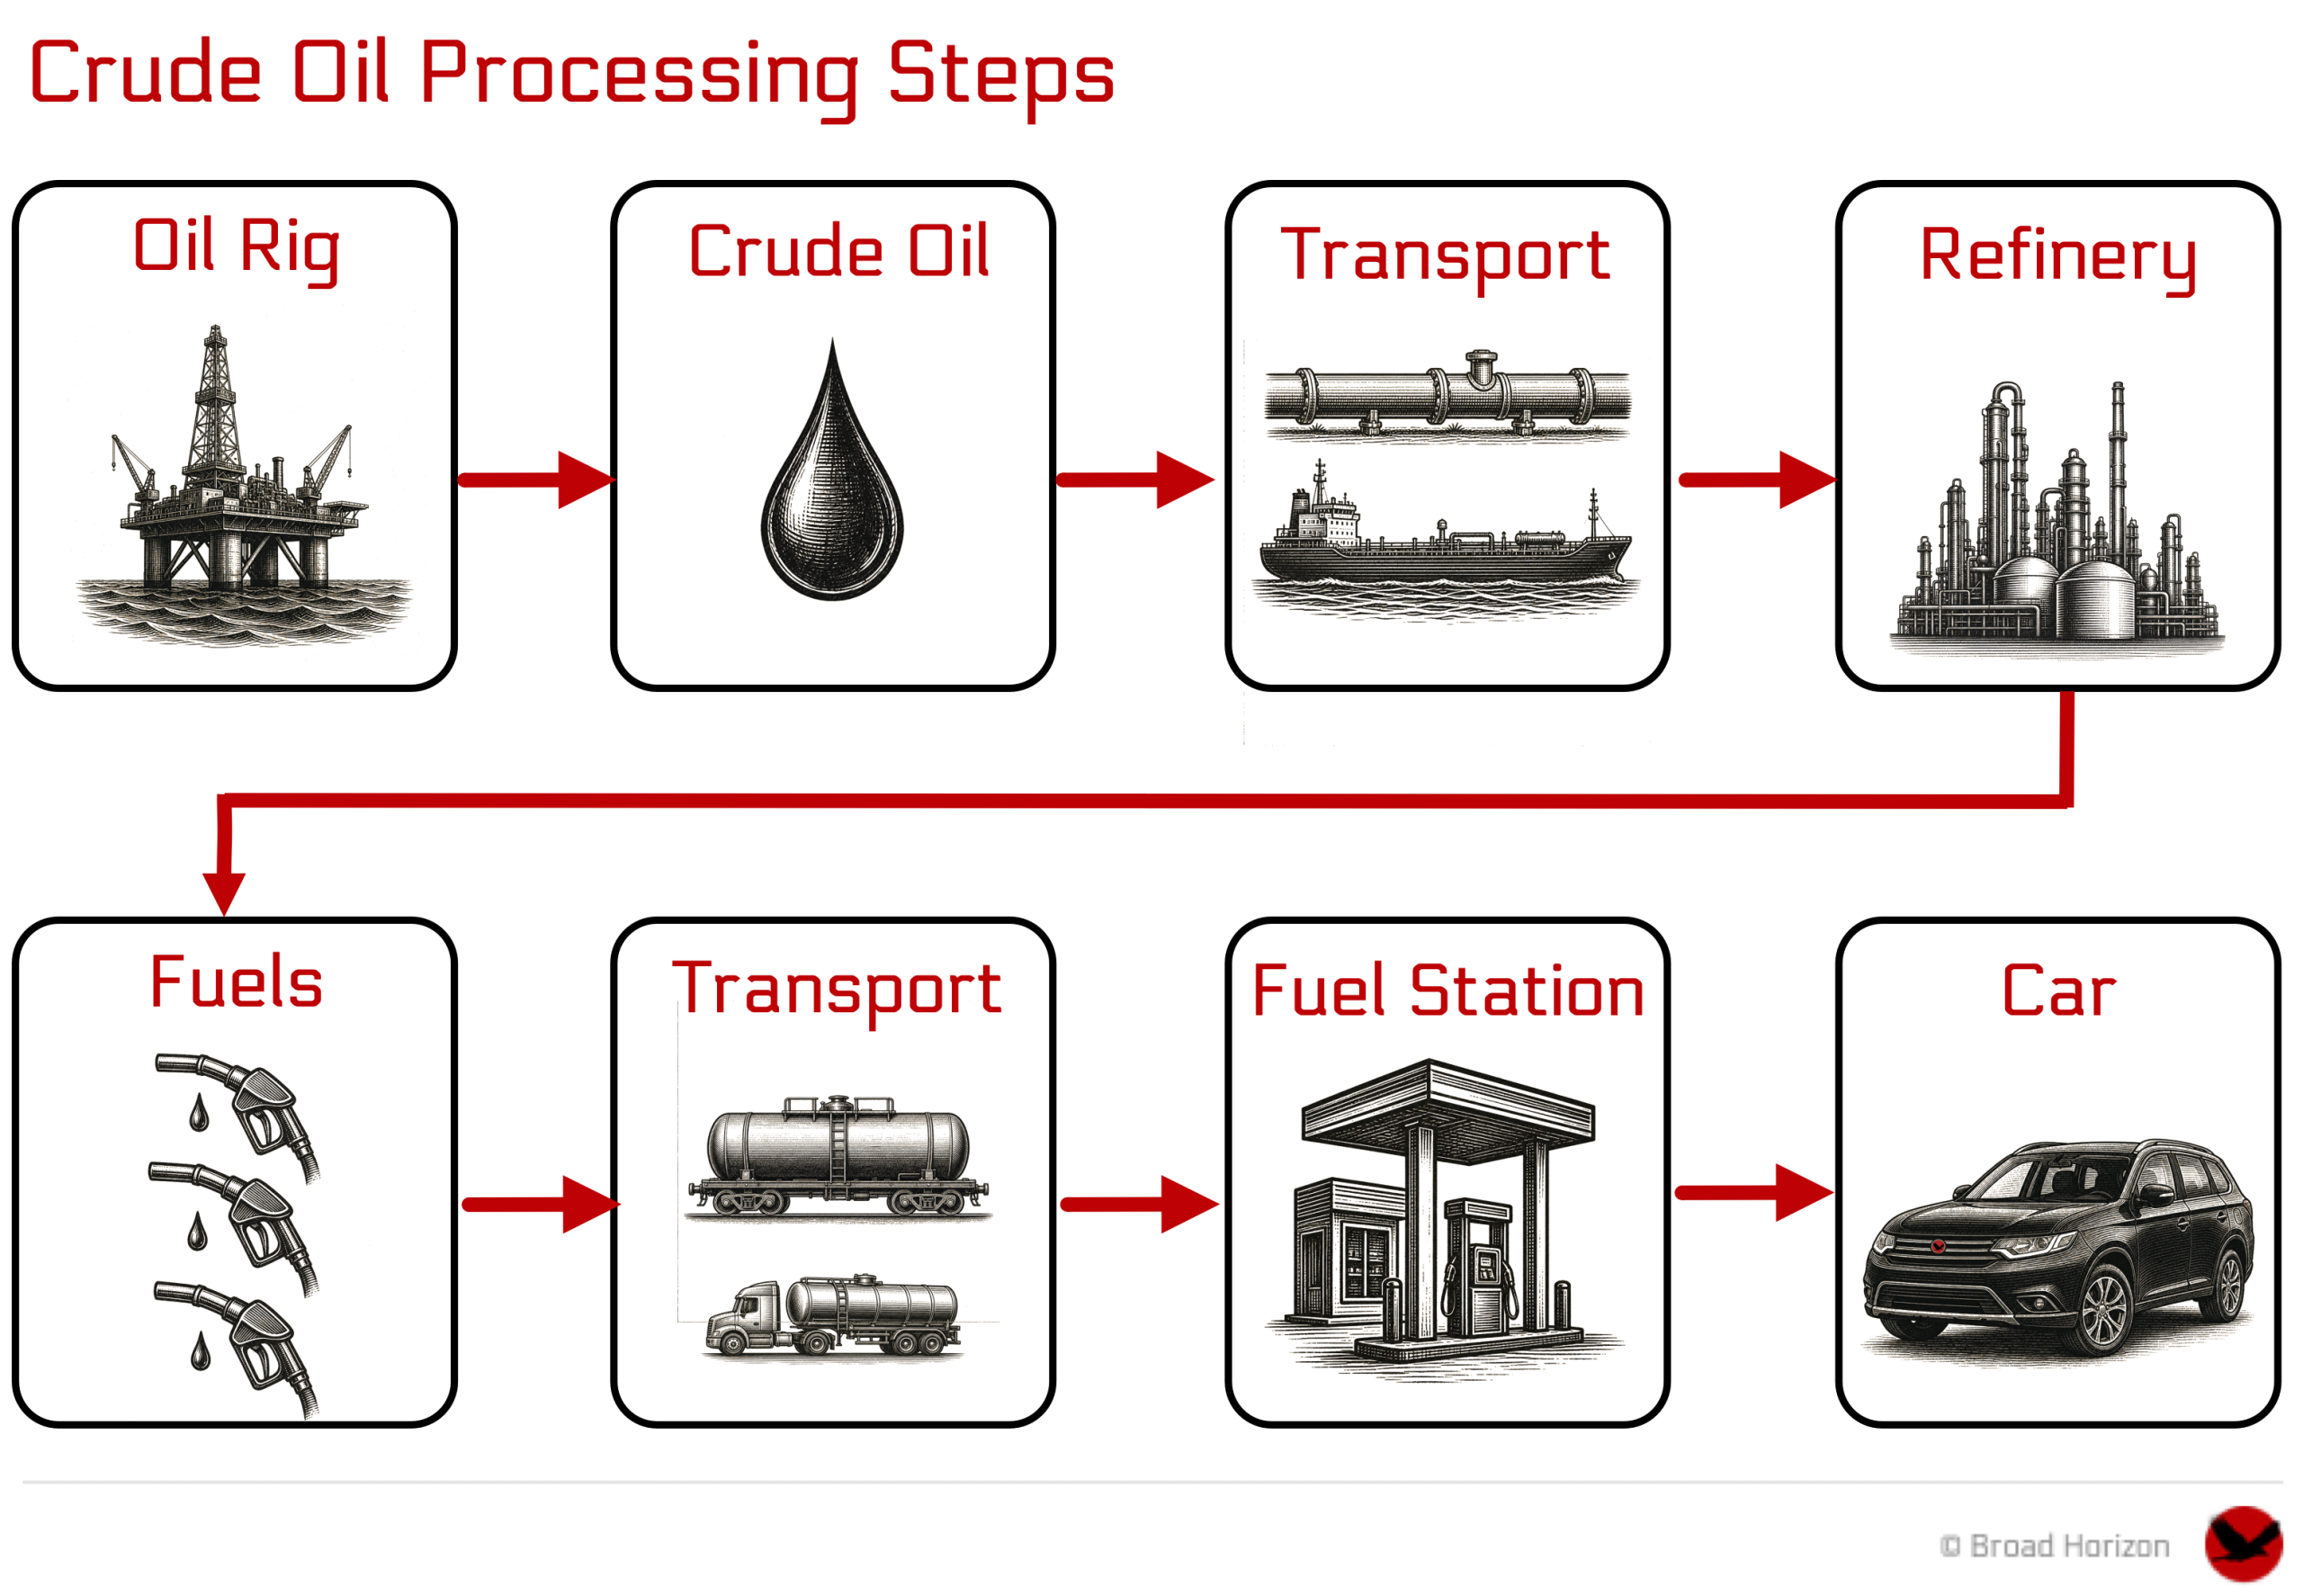
That global repricing eventually reaches the pump, but not as cleanly as the barrel price suggests, and Europe’s 2026 experience shows why. French petrol prices rose as much as 18 percent from the start of the year by April, with diesel up 36 percent — but roughly 60 percent of what a French driver pays at the pump is fixed tax, a per-liter excise duty plus VAT charged on both the fuel and the excise itself, so a given jump in crude cost arrives at the pump heavily diluted by a base that barely moves (La Finance Pour Tous, Apr 2026). The Netherlands shows the same dilution from a different angle: petrol opened 2026 near €2.19 a liter, spiked above €2.60 in May as the crisis peaked, and had settled back near €2.33 by August — a round trip that leaves the underlying rise since January looking closer to 6 percent than the mid-crisis spike implied (ANWB; Topgear, May 2026). Belgium and the EU-wide average moved on the same rough scale, up roughly a fifth since January (Fuel Prices EU, Aug 2026). For a household that already budgets for annual tax changes and seasonal swings, an increase spread over months and half-absorbed into a tax structure that would have taken its share anyway doesn’t register as a supply shock — it reads as this year’s fuel bill. That is a large part of why the pressure this crisis generates in Europe runs through diplomacy and industry rather than domestic anger at the pump: most of the people paying more rarely connect it to a strait several thousand miles away.
The shock doesn’t stop with fuel, either. A barrel of crude, refined and processed, yields — beyond transportation fuel — the raw material for plastics, synthetic rubber, fertilizers, pesticides, solvents, detergents, lubricants, textiles, packaging film, adhesives, and pharmaceuticals. When Gulf crude becomes expensive or uncertain, that entire downstream petrochemical chain feels cost pressure simultaneously: a German car manufacturer’s plastics and rubber costs, a French food company’s fertilizer prices, an American pharmaceutical producer’s solvent costs — none of these industries import Gulf crude directly, but all of them sit downstream of a supply chain that begins at Abqaiq or Basra. In the short term manufacturers absorb the cost or draw on inventory; over months they pass it forward, and a maritime logistics problem becomes industrial inflation.
There’s a second transmission belt running through Asia specifically. China, Japan, and South Korea are not only oil consumers — they are the manufacturing base for much of what Europe and North America import: electronics, vehicles, machinery, textiles, components. If sustained energy pressure slows Asian factories, those effects travel outward through global supply chains regardless of how little Gulf oil the eventual buyer imports directly. The dependency is systemic, not transactional.
Zoom out further, and there’s a structural force working against Hormuz leverage on a longer timescale, even though it offers no relief today. China’s investment in solar, wind, and EV’s is the largest version of it. But Europe is running the same experiment in real time, and this crisis is accelerating it, not just coinciding with it: EU electric-vehicle registrations hit 20.6 percent of new car sales in April 2026, up from 15.7 percent a year earlier, as the IEA found EV drivers saving 35 percent more on fuel costs than a year prior at $100-a-barrel oil. The European Commission estimates the shift has already cut EU car-related oil demand by roughly 140,000 barrels a day — about 4.5 percent — worth some €4.5 billion a year in avoided fossil-fuel imports (European Commission, June 2026). A country that needs significantly less oil in 2035 than in 2025 can sustain a Hormuz disruption for longer before political pressure becomes unbearable. But that timeline is years, not months, and the current crisis is unfolding in weeks — the transition changes the long-run calculus of leverage, not today’s.
Section 4 — Can It Be Replaced?
None of that price pressure disappears by finding oil elsewhere — but the instinctive response to any supply disruption is still to ask whether the missing volume can come from somewhere else. For Hormuz, the answer depends entirely on which country is asking. In aggregate, only about a quarter of the Strait’s total flow has any alternative route at all — but that low aggregate number is an average across countries in wildly different positions. Two of them, Saudi Arabia and the UAE, can reroute a large share of their own oil through pipelines built for exactly this. The rest — Iraq, Iran, Kuwait, Qatar — have next to nothing. Both facts are true; they’re just answers to different questions, and this section works through both.
Start with why land transport was never the answer. Moving 20.9 million barrels a day by land isn’t a logistics challenge, it’s an impossibility at any realistic timescale: a standard 100-car freight train carries about 70,000 barrels, so one VLCC cargo alone needs 28 such trains, and replacing the full daily Hormuz flow by rail would require on the order of 280 fully loaded trains a day, on tracks that don’t exist, crossing multiple borders, with terminal infrastructure that has never been built. Trucks aren’t worth calculating. Rail and road corridors matter for inland distribution and short-haul movements, but they cannot substitute for maritime bulk transport at oceanic scale — sea freight moves petroleum cheaply and at volume precisely because nothing else can.
Two systems do operate at meaningful scale, and both existed long before this crisis — neither was built to replace Hormuz, both to reduce vulnerability to it. Saudi Arabia’s East–West Pipeline (Petroline) runs from the Abqaiq processing complex across the Arabian Peninsula to the Red Sea port of Yanbu — nameplate capacity around 5 mb/d, temporarily expandable to 7 mb/d as Saudi Aramco did in 2019. The UAE’s second pipeline runs from its onshore fields to the Fujairah terminal on the Gulf of Oman, capacity around 1.8 mb/d — with a second, larger line to the same terminal under construction and roughly half-built as of mid-2026, targeting completion in 2027 (ADNOC, via Gulf Business, May 2026). Combined, what the IEA estimates can actually be mobilized from both is between 3.5 and 5.5 million barrels per day — against normal Hormuz throughput of 20.9 mb/d, that’s 17 to 26 percent of the flow, in aggregate. What that aggregate hides is coming up shortly.
Bypass capacity vs normal Hormuz throughput (mb/d)
IEA Strait of Hormuz 2026 Factsheet · EIA · © Broad Horizon
| Route | Operator | Capacity | Destination | Status |
|---|---|---|---|---|
| East–West Pipeline (Petroline) | Saudi Aramco | ~5 mb/d | Yanbu → Red Sea | Operational; used more during crisis |
| Fujairah pipeline | ADNOC (UAE) | ~1.8 mb/d | Gulf of Oman | Operational; second line ~50% built, targeting 2027, aiming for ~3 mb/d combined |
| Goreh-Jask pipeline | NIOC (Iran) | ~0.3 mb/d | Gulf of Oman | Barely operational since 2024 |
| Kirkuk-Ceyhan | Iraq/Turkey | <1 mb/d active | Mediterranean | Intermittent; politically constrained |
| Basra-Haditha (planned) | Iraq | ~2.5 mb/d target | Domestic, feeding western routes | Under construction, not yet operational |
| Kirkuk-Baniyas (reviving) | Iraq/Syria | ~2 mb/d initial target | Baniyas, Mediterranean (Syria) | Deal signed July 2026; pre-construction |
| Combined realistic bypass, operational today | ~3.5–5.5 mb/d | IEA estimate |
The bypass is not hypothetical — it’s operating right now under pressure. South Korea confirmed in April 2026 that it had secured 24 million barrels of Saudi crude and 16 million barrels of UAE crude for May delivery, routed specifically via Yanbu rather than the Persian Gulf: those barrels crossed the Arabian Peninsula by pipeline and loaded onto tankers at the Red Sea for delivery via the Suez Canal and the Indian Ocean (Korea Herald, April 2026). It’s viable, but not free — the voyage is longer, the shipping contracts differ, freight and insurance cost more — and it has limits: Yanbu and Red Sea loading infrastructure can absorb more volume, but not unlimited amounts, as more producers compete for the same berths and loading slots.
That 17–26 percent figure is a global average, and averages hide a split worth making explicit, because it isn’t evenly spread across the countries that hold the pipelines. Measured against their own exports rather than the strait’s total flow, Saudi Arabia and the UAE look like different countries entirely. Saudi Arabia’s total crude exports ran around 7 million barrels a day in February 2026; Yanbu carried roughly 2.9 million of that in March on average, 41 percent of Saudi’s own oil, and surged past 4 million barrels a day — 57 percent — in one peak week in mid-March (Baird Maritime, March 2026). Petroline’s own design ceiling, if run flat for exports rather than partly serving domestic refineries, is closer to 5.7–5.9 million barrels a day of the country’s 7 million-barrel total — meaning Saudi Arabia’s Hormuz-dependent share could theoretically fall as low as 16–19 percent, not the 40–60 percent it’s actually run at so far (Fortune, March 2026). The UAE has already gone further in practice: of its 3.46 million barrels a day of exports in July 2026, only 950,000 — 27 percent — still moved through Hormuz, with 2.28 million barrels a day, 66 percent, running via the Fujairah/Habshan bypass instead, up from 51 percent bypass just the month before (The National, August 2026). Both of those are a genuinely different picture from the 17–26 percent global figure, and closer to the scale of rerouting that outside reporting on this crisis has sometimes claimed for these two countries specifically. The full country-by-country breakdown is in the Dependency & Imports appendix.
Iraq is the starkest illustration of that ceiling in practice. Its southern, Hormuz-route export terminals collapsed by an estimated 89 percent by April 2026. The one land alternative it has, the Kirkuk-Ceyhan pipeline running north through Turkey, was moving only around 200,000 barrels a day as of mid-2026, with plans to expand toward 650,000 — and even at that maximum, that would replace only about 21 percent of the volume the south lost (Cryptobriefing, June 2026, citing Bloomberg). The northern route exists, and expansion is genuinely underway; it still isn’t close to enough.
Kuwait, Bahrain, and Qatar don’t appear anywhere in this picture because none of them have a bypass at all. Kuwait’s is zero, flatly: “as long as the strait remains blocked, oil exports are zero,” its own oil minister said in June 2026. Kuwait is now exploring three options with Saudi Arabia and the UAE — a Red Sea connection, a route via Oman, or a direct link to Fujairah — but all are still in early evaluation, with no capacity or completion date set (Pipeline Technology Journal, June 2026). Bahrain isn’t really part of this story at all: its own crude production is negligible, and the oil that moves through it is mostly Saudi crude arriving via the existing Abqaiq-Bahrain pipeline to supply its Sitra refinery — ordinary supply, not a Hormuz bypass. Qatar’s crude and condensate exports have no pipeline alternative either, for the same reason its LNG doesn’t: the country’s entire oil and gas trade is seaborne through the strait.
Two more routes surface regularly in outside coverage and are worth naming precisely, because both remain years from mattering. Iraq and Syria signed a deal in July 2026 to revive the decades-old Kirkuk-Baniyas pipeline to Syria’s Mediterranean coast, backed by a consortium that includes Chevron, targeting an initial capacity around 2 million barrels a day (Middle East Eye, July 2026). Even built out, it wouldn’t solve Iraq’s actual problem: the VLCCs that make Asia-bound sales economical can’t transit the Suez Canal from the Mediterranean side, so Baniyas crude would go to smaller-vessel European buyers, not to the Asian customers who take most of Iraq’s oil today. Israel and several Gulf states are separately discussing a Jordan–Aqaba–Eilat corridor — short-term, unloading tankers at Eilat for the existing pipeline to Ashkelon; long-term, new pipeline capacity through Jordan — but as of August 2026 this remains negotiation, not infrastructure. Israel’s own energy minister floats a four-to-five-year horizon before it matters, and a nearly identical UAE deal on the same route already collapsed once, in 2021, over environmental opposition (Israel Hayom, August 2026).
| Country | Baseline (b/d) | VLCC/day | Trains/day | Trucks/day |
|---|---|---|---|---|
| Saudi Arabia | 6,230,000 | ~3.0 | ~89 | ~31,150 |
| Iraq | 3,630,000 | ~1.7 | ~52 | ~18,150 |
| UAE | 3,240,000 | ~1.6 | ~46 | ~16,200 |
| Iran | 2,410,000 | ~1.2 | ~34 | ~12,050 |
| Kuwait | 2,370,000 | ~1.1 | ~34 | ~11,850 |
| Qatar | 1,430,000 | ~0.7 | ~20 | ~7,150 |
| Bahrain | 210,000 | ~0.1 | ~3 | ~1,050 |
| Oman | 0 | 0 | 0 | 0 |
Baseline capacity per country translated to VLCC, Train, Truck capacities per day equivalents
Zoom back out to the full picture, and the country split above is the whole explanation for why the global number stays low even though Saudi Arabia and the UAE individually do much better: Iraq, Iran, Kuwait, Bahrain, and Qatar together move serious volume with next to no bypass between them, and that volume — mostly crude heading to Asia and refined products — has no realistic alternative route today. Outside analysts, adding up every announced project including the ones above, put a future combined bypass ceiling around 11–12 million barrels a day — close to half of normal Hormuz flow — but that figure is a planning horizon, not a current fact: most of what it counts is under construction, pre-construction, or still being negotiated (The National, September 2026). Building any of it out to that scale would take years and a level of regional stability the current conflict isn’t providing. Bypass infrastructure is a real, substantial buffer for the two exporters who have it built out today — a partial one, nothing more, for everyone else, and mostly a future promise rather than present capacity for the rest.
Section 5 — Gas Plays by Different Rules
Everything so far is an oil story. And when discussing Geopolitics one can argue that the closing of Hormuz mainly affects East Asia and wonder why Europe or the Americas would be involved.
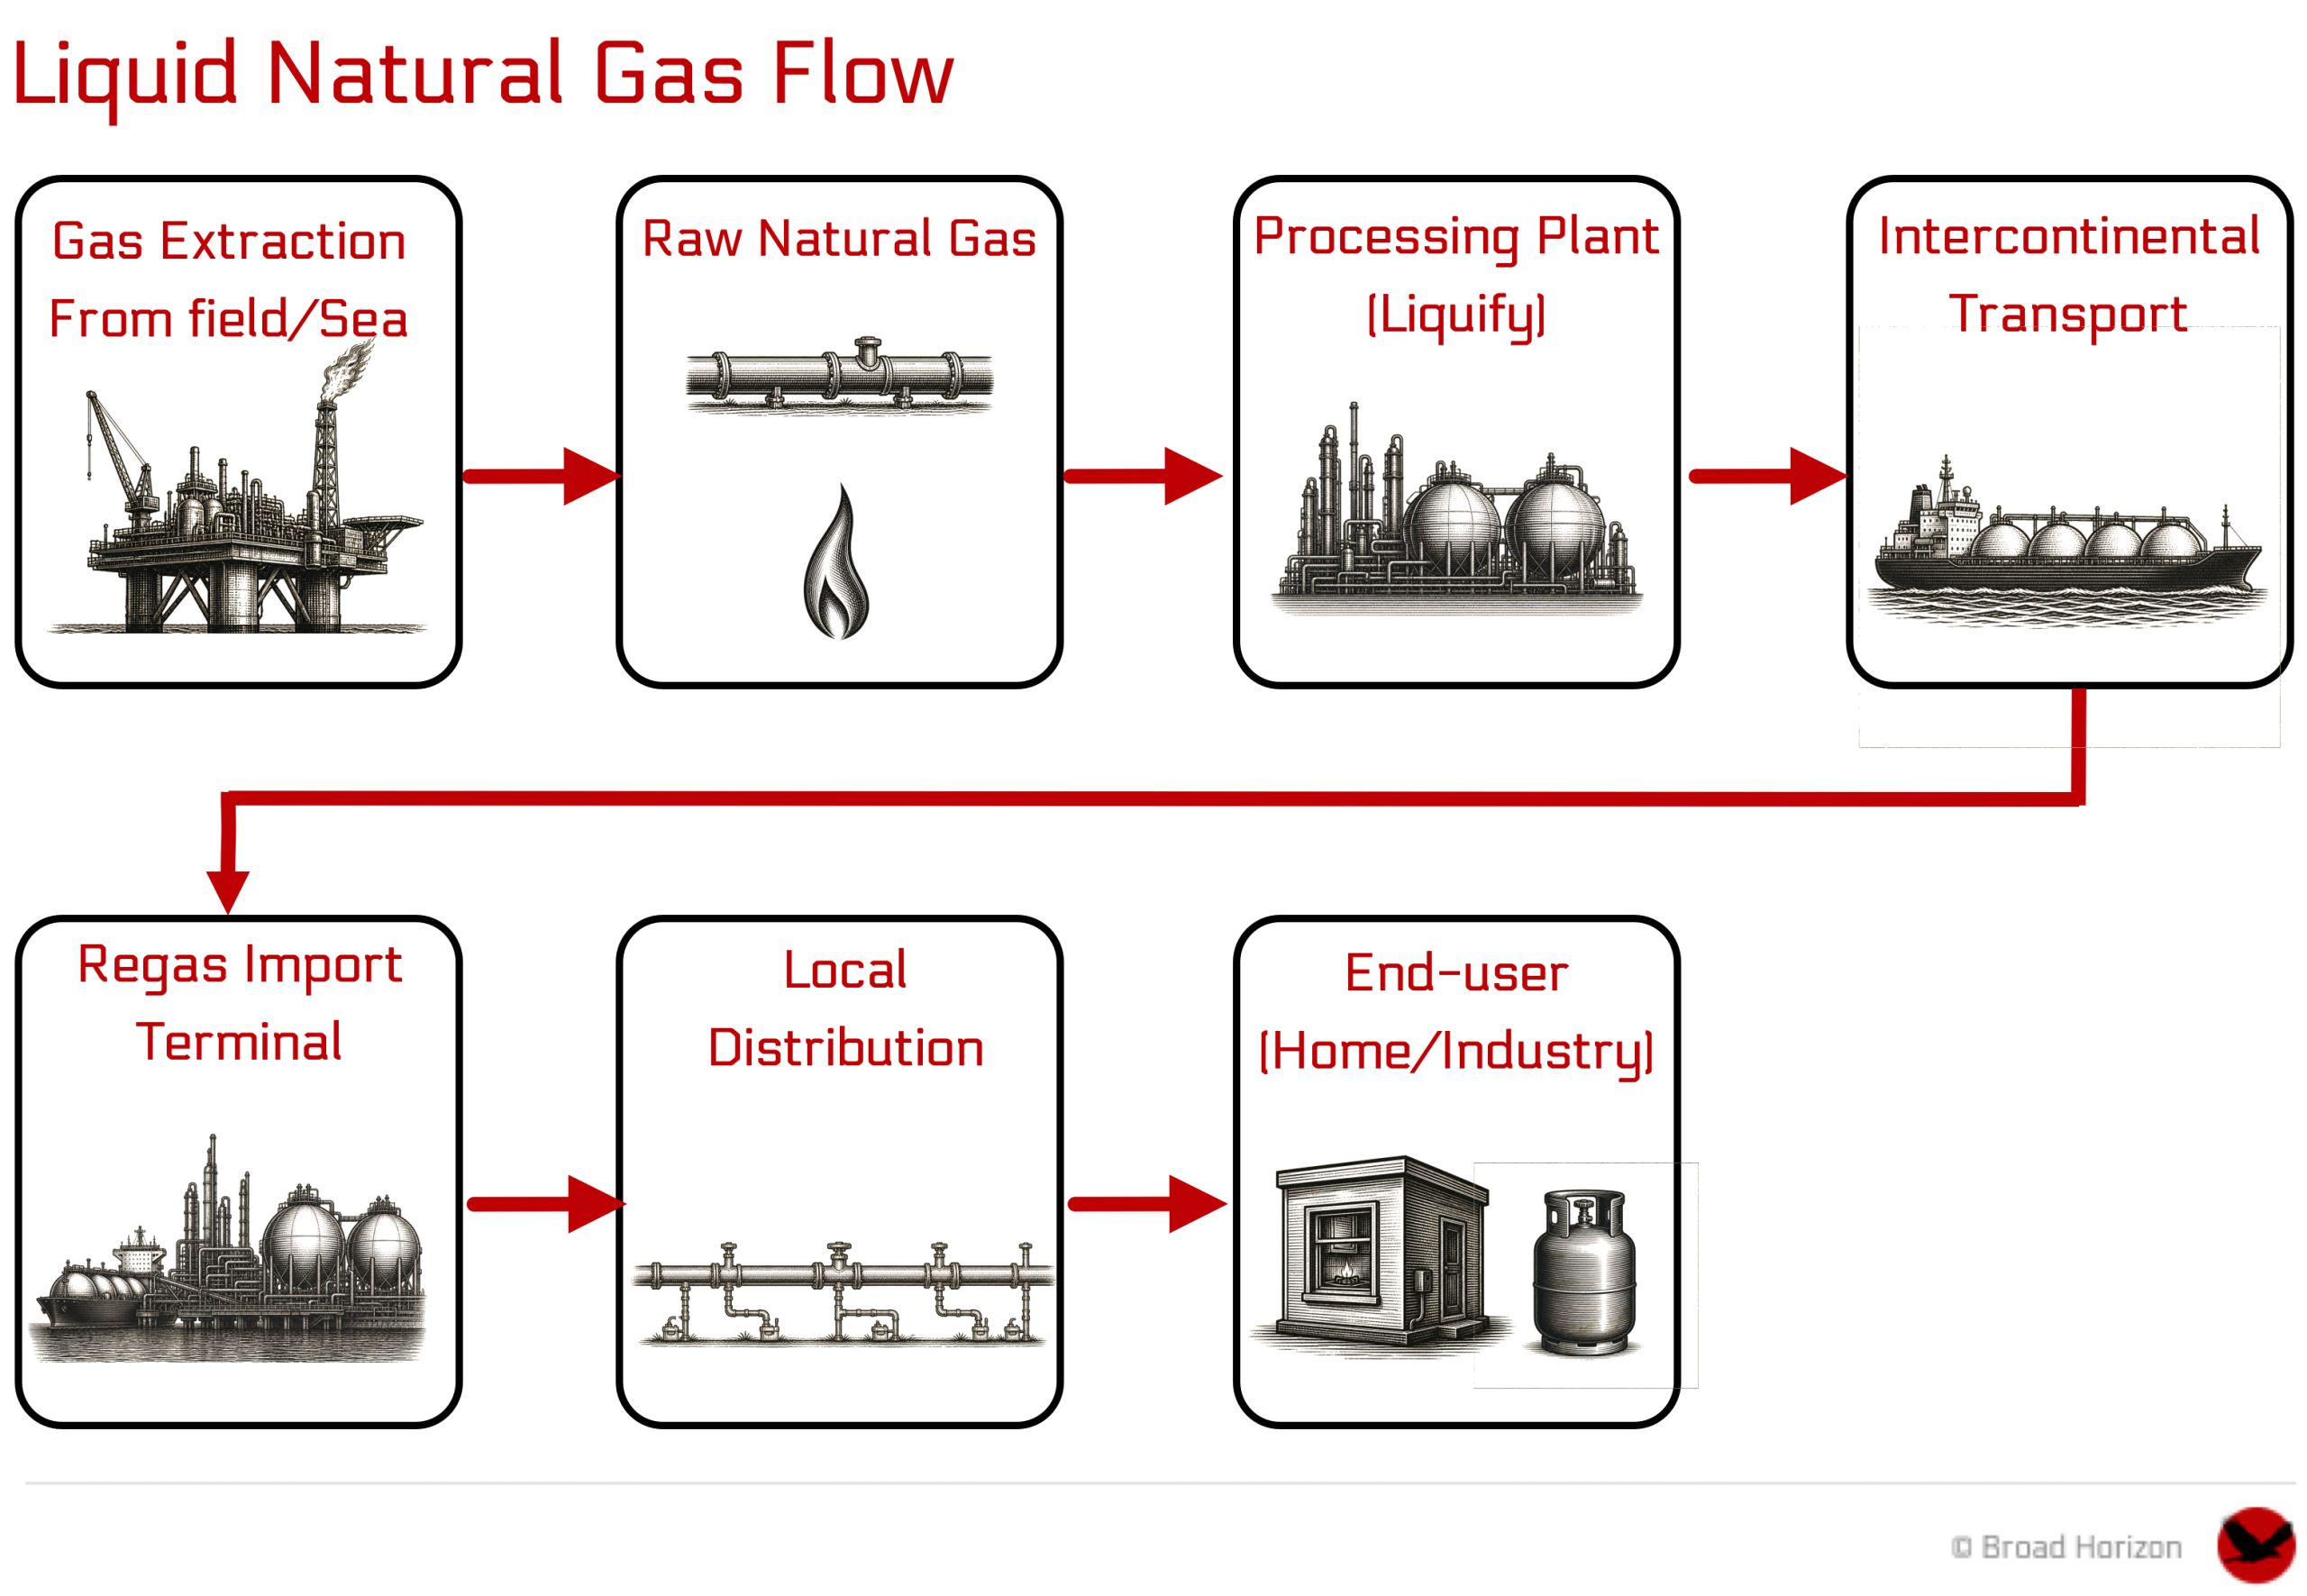
There is more: Natural Gas runs through the same strait, but not through the same market, and it broke a different way from day one. Roughly one-fifth of global LNG trade transits Hormuz, almost all of it Qatari cargo loaded at Ras Laffan, and that flow stopped in the same hours as the oil did: Iran’s February 28 closure of the strait halted LNG cargoes exactly as it halted crude, and no laden LNG vessel is confirmed to have crossed the strait between March 1 and April 24, 2026 (Kpler. data, via EIA). The price response looked, at first, like the oil shock’s twin — European TTF rose 35 percent and East Asian JKM 51 percent in those eight weeks, and by late July TTF had climbed to $20.91 per MMBtu, its highest close since January 2023 (EIA, April 2026; Kpler, July 2026). But the mechanism that spreads an oil shock to every importer on Earth doesn’t carry over to gas, because gas doesn’t share oil’s single global price — it trades on separate regional benchmarks that aren’t tightly linked to each other. US Henry Hub, the American benchmark, didn’t follow TTF and JKM up at all: it fell roughly 9 percent in the weeks after the closure and sat essentially flat through July, because most US gas moves through a domestic pipeline network with no direct link to a price set by a cargo reaching Rotterdam or Tokyo. A European or Asian LNG buyer felt this shock immediately and severely, the same way every oil buyer did. An American buyer of pipeline gas, largely, did not.
World natural gas production — top producers (2024)
Top producers, calendar 2024 (Energy Institute Statistical Review).
{"labels":["United States","Russia","Iran","China","Canada","Qatar","Australia","Saudi Arabia","Norway","Algeria","Malaysia","Turkmenistan","Indonesia","United Arab Emirates","Egypt"],"datasets":[{"label":"TWh","data":[10330.044,6298.639,2629.157,2483.896,1941.59,1794.504,1501.404,1214.825,1132,947.196,803.667,734.634,713.887,614.018,475.192],"backgroundColor":"#BD0104FF","borderColor":"#BD0104FF","pointBackgroundColor":"#BD0104FF","pointBorderColor":"#ffffff"}]}
Oil at least has a partial escape route through the Saudi and UAE pipelines. Gas has no bypass at all. Qatar’s liquefaction terminals at Ras Laffan, like Iran’s Kharg Island, sit inside the Gulf with no onward pipeline to a coast outside Hormuz — there is no Fujairah or Yanbu equivalent for gas, because LNG has to be loaded onto a ship at the plant that liquefies it, and every plant that liquefies Qatari gas is on the wrong side of the strait. When the closure stopped roughly 10 billion cubic feet a day of LNG — about 20 percent of global LNG trade, almost all of it Qatari — none of that volume had anywhere else to go (EIA, April 2026). The only offset came from other suppliers entirely: the US Department of Energy approved export-capacity increases at Plaquemines LNG (0.5 Bcf/d, March) and Elba Island (0.1 Bcf/d, April), a combined 0.6 Bcf/d against a 10 Bcf/d hole — not a bypass, a rounding error next to what went missing.
The buyers who lost the most from that gap aren’t the ones most exposed on oil. China and India — the two countries treated as “large but diversified” on crude — are actually Qatar’s largest LNG customers by volume, at more than 20 million and more than 10 million tonnes respectively in 2025, ahead of Japan and South Korea individually (Free Press Journal, 2025 trade data). Asia’s exposure to this closure runs on two separate maps that don’t overlap: Japan and South Korea for oil, China and India for gas.
Europe’s exposure runs on its own separate logic again. In aggregate, Qatar supplies only about 4 percent of the EU’s total gas imports — 8 percent of its LNG specifically — out of roughly 140 billion cubic meters of LNG the bloc brought in during 2025 (Bruegel, 2026). That bloc-wide average hides sharp variation between member states: Italy sourced close to a third of its LNG from Qatar in 2025, Belgium about a quarter, and Poland nearly a fifth, while France and Spain barely register, protected by stronger Norwegian ties and more diversified supply (Bruegel, 2026; Euronews, March 2026). None of Europe’s other options close that gap cleanly. Russian pipeline gas isn’t available regardless of Hormuz — the EU has mandated a full ban on it by the end of 2027, closing that door deliberately rather than temporarily. Norway, Europe’s other major non-Hormuz supplier, was pumping by mid-2026 with what officials describe as virtually no spare capacity — the binding constraint is processing and export infrastructure, not gas left in the ground. That leaves the US, which has moved from supplying 28 percent of Europe’s LNG in 2021 to 63 percent by the first quarter of 2026 — the real replacement for constrained Russian and Qatari volumes, and the reason the extra Plaquemines and Elba Island capacity matters as much to Europe as to Asia. With EU gas storage running at 45 percent against a 55 percent seasonal norm, the honest answer to “who fills the gap” is less a new supplier than reduced demand — efficiency, heat pumps, and renewables displacing consumption faster than any terminal can be built to replace it (Oilprice.com, 2026).
Qatar’s own trajectory points the same direction as the US, just slower — not a fix for this year’s shortfall, but this decade’s structural answer to it. QatarEnergy’s North Field expansion, still officially on schedule despite the Ras Laffan damage, is set to lift the country’s total LNG capacity from 77 to 142 million tonnes a year by the end of the decade, and one 2026 assessment projects Qatar’s share of EU LNG imports climbing from today’s roughly 8 percent to around 14 percent by 2030 — positioning Qatar, alongside the US, as one of the two suppliers anchoring Europe’s post-Russia gas strategy, even though a Hormuz closure is precisely the scenario in which Qatar temporarily can’t deliver on that role (CSIS, “Beyond Russian Gas: Trade-Offs in EU Liquefied Natural Gas Diversification”, May 2026).
Qatar LNG export destinations (2024)
UN Comtrade top destinations by trade value, calendar 2024.
{"labels":["China","Rep. Of Korea","India","United Arab Emirates","Pakistan","Others","Singapore","Italy","Japan","Kuwait","Bangladesh","Thailand","Belgium"],"datasets":[{"label":"USD","data":[10695135611.373,10193857724.391,9182002867.344,3494577644.564,3431783901.962,3138248753.44,2765523670.29,2417925970.225,2303464253.238,1992961210.776,1949650570.037,1846221417.696,1101806503.576],"backgroundColor":"#BD0104FF","borderColor":"#BD0104FF","pointBackgroundColor":"#BD0104FF","pointBorderColor":"#ffffff"}]}
Qatar’s own losses compound the shortfall on top of all this: Iranian strikes knocked out roughly 17 percent of Qatar’s export capacity directly when they hit the Ras Laffan facility on March 18, with repairs estimated at three to five years — not just a transit problem, but a production one (Chatham House, June 2026).
That same gas is also the feedstock for nitrogen fertilizer, and the closure hit that chain directly rather than through the price mechanism alone. Ammonia — the base input for urea and most nitrogen fertilizers — is manufactured from natural gas, not oil, so when Iran’s own ammonia production and Qatar’s urea and ammonia output both went offline alongside the LNG halt, it was a production disruption on top of a price one. Urea prices climbed above $850 a tonne by April 2026, up 80 percent since February and the highest level since April 2022, with the World Bank projecting close to a 60 percent rise for the year (World Bank, “Fertilizer prices surge as Strait of Hormuz disruptions tighten supplies,”. 2026) This report doesn’t follow that chain further, into food security or fertilizer-dependent economies — that’s a separate piece of work — but the fertilizer mentions elsewhere in this report, as one of several products refineries make from crude, undersell how directly this particular product runs through gas, not oil, and through this specific closure.
Iran itself is the sharpest illustration of how differently gas behaves. It shares the same offshore reservoir Qatar draws that Ras Laffan LNG from — Iran calls its side South Pars, Qatar calls its side North Dome — and holds the world’s second-largest gas reserves, but has never built an LNG export terminal, a casualty of decades of sanctions on the technology required. Its actual gas trade is roughly 15–20 billion cubic meters a year of pipeline exports to Iraq and Turkey, a fraction of the reservoir’s scale, and winter domestic demand routinely forces those exports lower rather than higher (Middle East Forum, “Iran’s Gas Wealth and the Limits of Export Capacity,”. 2026) The country sitting on the gas can’t sell it as LNG; the country that can is the one Iran just damaged.
This doesn’t produce the same kind of windfall oil created for outside producers, but it isn’t nothing either. The US is a major LNG exporter, and over the first half of 2026 its exports rose 23 percent year-on-year to 17.4 Bcf/d — mostly for a reason that has little to do with Iran: three new liquefaction trains (Plaquemines, Corpus Christi Stage 3, Golden Pass) came online in that same window, capacity that was largely on schedule to arrive regardless. What the closure did contribute was the price backdrop it made possible: with roughly a fifth of global LNG supply cut off, European and Asian benchmark prices stayed elevated for months, giving US exporters every incentive to run that new capacity near maximum output rather than ramp in gradually (EIA, “U.S. LNG exports rose 23% in the first half of 2026”). Unlike Iraq’s or China’s oil losses, this isn’t Hormuz redirecting Qatar’s former customers to US cargoes one-for-one — it’s new US capacity landing in a market this crisis happened to keep expensive. And it stayed a narrow benefit: the domestic Henry Hub price, tied to a separate pipeline market with no direct link to international LNG cargoes, still barely moved, so the upside accrued to LNG exporters selling abroad, not to the broader US gas industry. Higher oil income and a smaller, more indirect gas income bump aren’t the same story, even though both sit inside the same closure.
Henry Hub natural gas — daily (2025–Aug 2026)
EIA Henry Hub daily spot, USD/MMBtu, through 29 Aug 2026.
{"labels":["2025-01-02T00:00:00","2025-01-03T00:00:00","2025-01-06T00:00:00","2025-01-07T00:00:00","2025-01-08T00:00:00","2025-01-09T00:00:00","2025-01-10T00:00:00","2025-01-13T00:00:00","2025-01-14T00:00:00","2025-01-15T00:00:00","2025-01-16T00:00:00","2025-01-17T00:00:00","2025-01-21T00:00:00","2025-01-22T00:00:00","2025-01-23T00:00:00","2025-01-24T00:00:00","2025-01-27T00:00:00","2025-01-28T00:00:00","2025-01-29T00:00:00","2025-01-30T00:00:00","2025-01-31T00:00:00","2025-02-03T00:00:00","2025-02-04T00:00:00","2025-02-05T00:00:00","2025-02-06T00:00:00","2025-02-07T00:00:00","2025-02-10T00:00:00","2025-02-11T00:00:00","2025-02-12T00:00:00","2025-02-13T00:00:00","2025-02-14T00:00:00","2025-02-18T00:00:00","2025-02-19T00:00:00","2025-02-20T00:00:00","2025-02-21T00:00:00","2025-02-24T00:00:00","2025-02-25T00:00:00","2025-02-26T00:00:00","2025-02-27T00:00:00","2025-02-28T00:00:00","2025-03-03T00:00:00","2025-03-04T00:00:00","2025-03-05T00:00:00","2025-03-06T00:00:00","2025-03-07T00:00:00","2025-03-10T00:00:00","2025-03-11T00:00:00","2025-03-12T00:00:00","2025-03-13T00:00:00","2025-03-14T00:00:00","2025-03-17T00:00:00","2025-03-18T00:00:00","2025-03-19T00:00:00","2025-03-20T00:00:00","2025-03-21T00:00:00","2025-03-24T00:00:00","2025-03-25T00:00:00","2025-03-26T00:00:00","2025-03-27T00:00:00","2025-03-28T00:00:00","2025-03-31T00:00:00","2025-04-01T00:00:00","2025-04-02T00:00:00","2025-04-03T00:00:00","2025-04-04T00:00:00","2025-04-07T00:00:00","2025-04-08T00:00:00","2025-04-09T00:00:00","2025-04-10T00:00:00","2025-04-11T00:00:00","2025-04-14T00:00:00","2025-04-15T00:00:00","2025-04-16T00:00:00","2025-04-17T00:00:00","2025-04-21T00:00:00","2025-04-22T00:00:00","2025-04-23T00:00:00","2025-04-24T00:00:00","2025-04-25T00:00:00","2025-04-28T00:00:00","2025-04-29T00:00:00","2025-04-30T00:00:00","2025-05-01T00:00:00","2025-05-02T00:00:00","2025-05-05T00:00:00","2025-05-06T00:00:00","2025-05-07T00:00:00","2025-05-08T00:00:00","2025-05-09T00:00:00","2025-05-12T00:00:00","2025-05-13T00:00:00","2025-05-14T00:00:00","2025-05-15T00:00:00","2025-05-16T00:00:00","2025-05-19T00:00:00","2025-05-20T00:00:00","2025-05-21T00:00:00","2025-05-22T00:00:00","2025-05-23T00:00:00","2025-05-27T00:00:00","2025-05-28T00:00:00","2025-05-29T00:00:00","2025-05-30T00:00:00","2025-06-02T00:00:00","2025-06-03T00:00:00","2025-06-04T00:00:00","2025-06-05T00:00:00","2025-06-06T00:00:00","2025-06-09T00:00:00","2025-06-10T00:00:00","2025-06-11T00:00:00","2025-06-12T00:00:00","2025-06-13T00:00:00","2025-06-16T00:00:00","2025-06-17T00:00:00","2025-06-18T00:00:00","2025-06-20T00:00:00","2025-06-23T00:00:00","2025-06-24T00:00:00","2025-06-25T00:00:00","2025-06-26T00:00:00","2025-06-27T00:00:00","2025-06-30T00:00:00","2025-07-01T00:00:00","2025-07-02T00:00:00","2025-07-03T00:00:00","2025-07-07T00:00:00","2025-07-08T00:00:00","2025-07-09T00:00:00","2025-07-10T00:00:00","2025-07-11T00:00:00","2025-07-14T00:00:00","2025-07-15T00:00:00","2025-07-16T00:00:00","2025-07-17T00:00:00","2025-07-18T00:00:00","2025-07-21T00:00:00","2025-07-22T00:00:00","2025-07-23T00:00:00","2025-07-24T00:00:00","2025-07-25T00:00:00","2025-07-28T00:00:00","2025-07-29T00:00:00","2025-07-30T00:00:00","2025-07-31T00:00:00","2025-08-01T00:00:00","2025-08-04T00:00:00","2025-08-05T00:00:00","2025-08-06T00:00:00","2025-08-07T00:00:00","2025-08-08T00:00:00","2025-08-11T00:00:00","2025-08-12T00:00:00","2025-08-13T00:00:00","2025-08-14T00:00:00","2025-08-15T00:00:00","2025-08-18T00:00:00","2025-08-19T00:00:00","2025-08-20T00:00:00","2025-08-21T00:00:00","2025-08-22T00:00:00","2025-08-25T00:00:00","2025-08-26T00:00:00","2025-08-27T00:00:00","2025-08-28T00:00:00","2025-08-29T00:00:00","2025-09-02T00:00:00","2025-09-03T00:00:00","2025-09-04T00:00:00","2025-09-05T00:00:00","2025-09-08T00:00:00","2025-09-09T00:00:00","2025-09-10T00:00:00","2025-09-11T00:00:00","2025-09-12T00:00:00","2025-09-15T00:00:00","2025-09-16T00:00:00","2025-09-17T00:00:00","2025-09-18T00:00:00","2025-09-19T00:00:00","2025-09-22T00:00:00","2025-09-23T00:00:00","2025-09-24T00:00:00","2025-09-25T00:00:00","2025-09-26T00:00:00","2025-09-29T00:00:00","2025-09-30T00:00:00","2025-10-01T00:00:00","2025-10-02T00:00:00","2025-10-03T00:00:00","2025-10-06T00:00:00","2025-10-07T00:00:00","2025-10-08T00:00:00","2025-10-09T00:00:00","2025-10-10T00:00:00","2025-10-13T00:00:00","2025-10-14T00:00:00","2025-10-15T00:00:00","2025-10-16T00:00:00","2025-10-17T00:00:00","2025-10-20T00:00:00","2025-10-21T00:00:00","2025-10-22T00:00:00","2025-10-23T00:00:00","2025-10-24T00:00:00","2025-10-27T00:00:00","2025-10-28T00:00:00","2025-10-29T00:00:00","2025-10-30T00:00:00","2025-10-31T00:00:00","2025-11-03T00:00:00","2025-11-04T00:00:00","2025-11-05T00:00:00","2025-11-06T00:00:00","2025-11-07T00:00:00","2025-11-10T00:00:00","2025-11-12T00:00:00","2025-11-13T00:00:00","2025-11-14T00:00:00","2025-11-17T00:00:00","2025-11-18T00:00:00","2025-11-19T00:00:00","2025-11-20T00:00:00","2025-11-21T00:00:00","2025-11-24T00:00:00","2025-11-25T00:00:00","2025-11-26T00:00:00","2025-12-01T00:00:00","2025-12-02T00:00:00","2025-12-03T00:00:00","2025-12-04T00:00:00","2025-12-05T00:00:00","2025-12-08T00:00:00","2025-12-09T00:00:00","2025-12-10T00:00:00","2025-12-11T00:00:00","2025-12-12T00:00:00","2025-12-15T00:00:00","2025-12-16T00:00:00","2025-12-17T00:00:00","2025-12-18T00:00:00","2025-12-19T00:00:00","2025-12-22T00:00:00","2025-12-23T00:00:00","2025-12-24T00:00:00","2025-12-29T00:00:00","2025-12-30T00:00:00","2025-12-31T00:00:00","2026-01-05T00:00:00","2026-01-06T00:00:00","2026-01-07T00:00:00","2026-01-08T00:00:00","2026-01-09T00:00:00","2026-01-12T00:00:00","2026-01-13T00:00:00","2026-01-14T00:00:00","2026-01-15T00:00:00","2026-01-16T00:00:00","2026-01-20T00:00:00","2026-01-21T00:00:00","2026-01-22T00:00:00","2026-01-23T00:00:00","2026-01-26T00:00:00","2026-01-27T00:00:00","2026-01-28T00:00:00","2026-01-29T00:00:00","2026-01-30T00:00:00","2026-02-02T00:00:00","2026-02-03T00:00:00","2026-02-04T00:00:00","2026-02-05T00:00:00","2026-02-06T00:00:00","2026-02-09T00:00:00","2026-02-10T00:00:00","2026-02-11T00:00:00","2026-02-12T00:00:00","2026-02-13T00:00:00","2026-02-17T00:00:00","2026-02-18T00:00:00","2026-02-19T00:00:00","2026-02-20T00:00:00","2026-02-23T00:00:00","2026-02-24T00:00:00","2026-02-25T00:00:00","2026-02-26T00:00:00","2026-02-27T00:00:00","2026-03-02T00:00:00","2026-03-03T00:00:00","2026-03-04T00:00:00","2026-03-05T00:00:00","2026-03-06T00:00:00","2026-03-09T00:00:00","2026-03-10T00:00:00","2026-03-11T00:00:00","2026-03-12T00:00:00","2026-03-13T00:00:00","2026-03-16T00:00:00","2026-03-17T00:00:00","2026-03-18T00:00:00","2026-03-19T00:00:00","2026-03-20T00:00:00","2026-03-23T00:00:00","2026-03-24T00:00:00","2026-03-25T00:00:00","2026-03-26T00:00:00","2026-03-27T00:00:00","2026-03-30T00:00:00","2026-03-31T00:00:00","2026-04-01T00:00:00","2026-04-02T00:00:00","2026-04-06T00:00:00","2026-04-07T00:00:00","2026-04-08T00:00:00","2026-04-09T00:00:00","2026-04-10T00:00:00","2026-04-13T00:00:00","2026-04-14T00:00:00","2026-04-15T00:00:00","2026-04-16T00:00:00","2026-04-17T00:00:00","2026-04-20T00:00:00","2026-04-21T00:00:00","2026-04-22T00:00:00","2026-04-23T00:00:00","2026-04-24T00:00:00","2026-04-27T00:00:00","2026-04-28T00:00:00","2026-04-29T00:00:00","2026-04-30T00:00:00","2026-05-01T00:00:00","2026-05-04T00:00:00","2026-05-05T00:00:00","2026-05-06T00:00:00","2026-05-07T00:00:00","2026-05-08T00:00:00","2026-05-11T00:00:00","2026-05-12T00:00:00","2026-05-13T00:00:00","2026-05-14T00:00:00","2026-05-15T00:00:00","2026-05-18T00:00:00","2026-05-19T00:00:00","2026-05-20T00:00:00","2026-05-21T00:00:00","2026-05-22T00:00:00","2026-05-26T00:00:00","2026-05-27T00:00:00","2026-05-28T00:00:00","2026-05-29T00:00:00","2026-06-01T00:00:00","2026-06-02T00:00:00","2026-06-03T00:00:00","2026-06-04T00:00:00","2026-06-05T00:00:00","2026-06-08T00:00:00","2026-06-09T00:00:00","2026-06-10T00:00:00","2026-06-11T00:00:00","2026-06-12T00:00:00","2026-06-15T00:00:00","2026-06-16T00:00:00","2026-06-17T00:00:00","2026-06-18T00:00:00","2026-06-22T00:00:00","2026-06-23T00:00:00","2026-06-24T00:00:00","2026-06-25T00:00:00","2026-06-26T00:00:00","2026-06-29T00:00:00","2026-06-30T00:00:00","2026-07-01T00:00:00","2026-07-02T00:00:00","2026-07-06T00:00:00","2026-07-07T00:00:00","2026-07-08T00:00:00","2026-07-09T00:00:00","2026-07-10T00:00:00","2026-07-13T00:00:00","2026-07-14T00:00:00","2026-07-15T00:00:00","2026-07-16T00:00:00","2026-07-17T00:00:00","2026-07-20T00:00:00","2026-07-21T00:00:00","2026-07-22T00:00:00","2026-07-23T00:00:00","2026-07-24T00:00:00","2026-07-27T00:00:00","2026-07-28T00:00:00","2026-07-29T00:00:00","2026-07-30T00:00:00","2026-07-31T00:00:00","2026-08-03T00:00:00","2026-08-04T00:00:00","2026-08-05T00:00:00","2026-08-06T00:00:00","2026-08-07T00:00:00","2026-08-10T00:00:00","2026-08-11T00:00:00","2026-08-12T00:00:00","2026-08-13T00:00:00","2026-08-14T00:00:00","2026-08-17T00:00:00","2026-08-18T00:00:00","2026-08-19T00:00:00","2026-08-20T00:00:00","2026-08-21T00:00:00","2026-08-24T00:00:00","2026-08-25T00:00:00","2026-08-26T00:00:00","2026-08-27T00:00:00","2026-08-28T00:00:00"],"datasets":[{"label":"USD\/MMBtu","data":[3.65,3.4,4.05,3.8,3.75,3.94,4.13,4.4,4.32,4.45,4.3,9.86,4.4,3.91,3.91,3.84,3.71,3.4,3.38,3.12,2.93,3.3,3.25,3.22,3.31,3.32,3.48,3.65,3.97,4.43,4.6,6.4,7.15,5.62,4.43,3.86,3.88,3.9,3.91,3.91,3.8,4.39,4.4,4.39,4.39,4.23,4.57,4.18,3.89,3.89,4.15,4.17,4.21,4.23,3.93,4.03,3.94,3.85,3.88,3.89,4.11,3.96,4.04,4.21,4.04,3.97,3.85,3.42,3.7,3.44,3.57,3.27,3.25,2.94,3.16,3.12,3.12,2.87,2.71,2.96,3.17,3.12,3.08,3.1,3.26,3.08,3.18,3.23,3.22,3.19,3.27,3.31,3.2,3.01,2.96,3.15,3.2,3,2.93,3.2,3.09,2.97,2.86,3,2.84,2.8,2.86,2.68,3.13,2.79,2.73,2.9,2.65,2.9,2.9,3.43,3.09,3.5,3.3,3.26,3.23,3.23,3.26,3.14,3.1,3.24,3.24,3.2,3.08,3.11,3.22,3.21,3.31,3.42,3.52,3.5,3.5,3.16,3.08,3.13,3.1,3.12,3.08,2.98,2.99,3,2.89,2.98,3.02,3.05,3.03,3.05,2.93,2.95,2.78,2.98,2.96,2.87,2.8,2.88,2.76,2.76,2.82,2.88,2.9,2.88,2.7,3,3.11,3.05,3.1,3.12,2.89,2.81,2.86,3,3.07,3.19,3.1,2.89,2.9,2.86,2.88,2.98,2.9,2.93,3.12,3.24,3.32,3.19,3.32,3.32,3.35,3.25,2.9,2.9,2.83,2.79,2.82,2.65,2.99,3.28,3.45,3.34,3.21,3.3,3.44,3.36,3.46,3.57,3.37,3.35,3.51,3.71,3.76,3.8,3.6,3.6,3.49,3.71,3.7,3.94,3.97,4.13,4.15,4.12,4.59,5.08,4.83,4.86,4.89,5.19,5.19,4.76,4.62,4.35,4.07,3.9,3.58,3.66,3.87,3.58,3.67,3.38,3.31,4.35,4.4,4,2.82,2.85,3.1,2.92,2.87,2.9,3,3.13,2.92,3.06,4,4.96,8.42,30.72,25.01,17.19,9.34,10.25,7.18,4.4,4.11,6.88,5.28,4.37,3.25,3.18,3.25,3.43,3.24,3.13,2.98,3.09,3.15,3.13,2.99,3.02,2.94,2.99,2.99,3.1,2.87,2.9,3.1,3.25,3.08,3.15,3.27,3.2,3.03,3.14,3.12,3.21,3.04,2.94,2.9,2.94,2.99,2.99,2.88,2.88,2.99,2.86,3.04,3.01,2.78,2.78,2.64,2.79,2.79,2.78,2.78,2.71,2.81,2.76,2.75,2.65,2.54,2.72,2.7,2.6,2.64,2.63,2.67,2.83,2.75,2.7,2.75,2.82,2.91,2.88,2.79,2.89,3.07,3.23,3.18,3.14,2.92,3.1,3.13,3.04,3.34,3.07,2.97,2.97,3.08,3.05,3.1,3.18,3.27,3.16,3.06,3.06,3.1,3.25,3.08,3.16,3.15,3.19,3.21,3.26,3.33,3.34,3.34,3.34,3.29,3.13,3.13,3.17,2.73,2.83,2.76,2.8,2.83,2.75,2.8,2.8,2.93,2.92,2.87,2.63,2.65,2.58,2.65,2.59,2.81,2.74,2.6,2.6,2.56,2.72,2.79,2.82,2.82,2.79,2.77,2.82,2.94,2.94,2.82,2.83,2.7,2.81,2.89,2.82],"backgroundColor":"#BD0104FF","borderColor":"#BD0104FF","pointBackgroundColor":"#BD0104FF","pointBorderColor":"#ffffff"}]}
Gas has its own version of oil’s long-run demand erosion, and it’s showing up as policy faster than oil’s ever did. South Korea — more dependent on imported LNG for power than any other importer exposed to this closure, with 28 percent of its electricity generated from imported gas against just 6 percent from renewables today — announced a target of 100 gigawatts of renewable capacity by 2030 explicitly framed around this crisis, with President Lee Jae Myung calling it “an opportunity to swiftly and extensively transition to renewable energy” rather than a threat to be managed (Gas Outlook; Global Energy Monitor, 2026).
Europe’s version is already banked rather than promised: solar and wind cut the bloc’s fossil-fuel import bill by an estimated €51 billion in 2025 alone, before this crisis even began, with solar generation up 60 terawatt-hours year-on-year (Euronews, May 2026). Both movements run on the same logic as oil’s own demand erosion — they change how much leverage a closed strait carries in 2030, not how much it carries this year.
Section 6 — The Clock Starts Ticking
A note on terminology before the numbers: this section uses “reserves” for two genuinely different things, because the industry itself does. The table just below is about stockpile reserves — oil already extracted and sitting in storage (strategic plus commercial stocks), measured in days of supply. Further down, in “A different clock,” is a separate table about proven reserves — oil still in the ground, measured in years against current production. A country can be well-supplied on one and exposed on the other simultaneously, as Iran and Iraq’s numbers later in this section show; the two aren’t a single sliding scale.
None of that long-run erosion helps anyone still holding the line today, though — that math is measured in decades, and the pressure building right now is measured in days of supply. Strategic reserves exist for one purpose: to convert an immediate physical shock into a problem that unfolds over time. They do not prevent disruption; they delay its consequences long enough for governments, markets, and supply chains to respond. The question that determines how much leverage a Hormuz closure actually generates is therefore not whether importers have reserves — they all do — but how long those reserves sustain normal operations before economic and political pressure forces a change in behavior. The arithmetic is less straightforward than it looks.
Reserve Runway Calculator
A common instinct is to divide reserve days by Hormuz exposure and read the result as time available before crisis — a country with 100 days of reserves and 20 percent Hormuz exposure would, on this reasoning, have 500 days before that supply source is exhausted. That’s correct in structure but misleading in implication: reserves don’t last until they’re physically empty, they last until drawing them down becomes politically unsustainable, economically disruptive, or strategically counterproductive — all of which happen well before the tanks reach zero. The practical threshold for action generally arrives when reserves fall below 60 to 90 days of consumption; below that, governments face rationing, accelerating emergency releases, premium-priced emergency contracts, or politically damaging shortages, and all of these are chosen earlier than the raw arithmetic would suggest.
Underneath that arithmetic, two separate pressure systems are actually running at different speeds. The price clock started within hours of the escalation and runs independently of physical reality, driven purely by market expectations of shortage — it has stayed elevated for six months without settling on a floor. The physical stock clock runs more slowly, measured in months, and is what governments are actually managing when they release strategic reserves, negotiate emergency supply, and reroute procurement. The important point: political breaking points typically arrive from the price clock — inflation, industrial slowdown, public pressure — months before the physical clock reaches a critical level. A government doesn’t need empty fuel tanks to face a crisis.
Here’s the reserve picture by country, as of December 2025, before the March 2026 IEA coordinated release:
| Country | Total stocks | Reserve days (demand basis) | Hormuz share of demand | Theoretical runway |
|---|---|---|---|---|
| China | ~1,400 Mb (govt + commercial) | ~85 days | ~28% | ~304 days |
| India | ~75 Mb total | ~74 days | ~26% | ~285 days |
| Japan | ~483 Mb (govt + industry) | ~138 days | ~92% | ~150 days |
| South Korea | ~79 Mb (pre-release) | ~67 days combined | ~54% | ~124 days (pre-release) |
(Sources: EIA strategic inventories(https://www.eia.gov/todayinenergy/detail.php?id=67504), April 2026; Q2 importer matrix) Note: “reserve days” isn’t computed on a uniform basis across rows — dividing China’s and Japan’s stocks by their reserve-days figure implies a denominator close to total oil demand, while India’s and South Korea’s imply a much smaller one, closer to Hormuz-linked import volume specifically. That’s inherited from how each country’s own agencies report reserve adequacy, not a calculation introduced here, but it means the country rows aren’t strictly apples-to-apples — treat cross-country comparisons in this table as indicative, not precise.)
These theoretical-runway figures assume zero substitution, which has never held in practice — India cut its Hormuz exposure from 45 to 30 percent within weeks, and South Korea secured non-Hormuz Yanbu barrels by April. The real runway runs longer for countries that can substitute, and shorter for those that can’t.
South Korea is the exposed outlier: it drew its reserves down to 26 days of coverage after contributing 22.46 million barrels to the IEA’s March 2026 coordinated release — a national record — then cut its mandatory private reserve requirement from 40 to 20 days to meet IEA obligations, leaving it with roughly 25–35 days of buffer against 54 percent Hormuz dependence, the thinnest margin and most acute time pressure of any country in this crisis.
South Korea — reserve trajectory (sourced)
{"labels":["1 \u2014 Pre-crisis stocks","3 \u2014 IEA emergency drawdown"],"datasets":[{"label":"Value","data":[79,22.46],"backgroundColor":"#BD0104FF","borderColor":"#BD0104FF","pointBackgroundColor":"#BD0104FF","pointBorderColor":"#ffffff"}]}
China sits at the other extreme: the longest runway and the least transparency. It has an estimated 1.4 billion barrels of combined stocks — larger than all 32 IEA members combined — self-reported through third-party tracking rather than direct disclosure, giving a theoretical ~300-day runway. That figure functions as an outer bound, not a planning timeline: China’s actual point of action is set by economics and politics, not inventory math.
Put every country on the same timeline and a window emerges. South Korea faces acute pressure within months; Japan within about five months at current exposure; China and India have the better part of a year at worst-case substitution rates, but both face mounting economic cost from the price clock regardless. Putting these together, the effective strategic leverage window — the period during which disruption generates real pressure before importers have fully reorganized around the closure — is roughly four to six months for the most exposed importers. As of this update, that window has passed, without a durable resolution.
The United States is conspicuously absent from these reserve tables. Not because it lacks reserves, but because its exposure never ran through this channel in the first place — which is exactly why Washington’s continued, escalating involvement in this crisis needs its own explanation.
A different clock: reserves against total self-sufficiency
Everything above measures a stockpile buffer — weeks to months, specific to this crisis. A separate, much longer-run number is easy to confuse with it: the reserves-to-production ratio, which divides a country’s proven oil reserves by its current annual output to ask a different question entirely. Not “how long can this country wait out a Hormuz closure,” but “how long could this country’s own ground supply it if cut off from the rest of the world completely, indefinitely, with no imports and no exports at all.” It’s a theoretical ceiling, not a forecast — production rates aren’t flat over decades, and no country actually produces at a constant rate until the reserves run dry. The full country-by-country table is in the Reserves appendix below.
Iran and Iraq — the two countries this report has spent several sections describing as under acute, immediate pressure from a closed strait — sit at the top of an entirely different ranking on this measure: reserves that would outlast a century of production at current rates, if the question were geological abundance rather than market access. That’s not a contradiction. It’s the transit/import/demand distinction from Section 2, restated at a much longer timescale: having the oil and getting it to a paying customer are separate facts, and this report has been about the second one throughout. Japan and South Korea sit at the opposite pole from where they sit in the reserve-days table above — acute exposure on both the short clock and this long one, with essentially no domestic reserves to fall back on under any timeframe.
Section 7 — Why Washington is Involved
The US shows up in more places in this report than any other single country, and not by accident — it’s the one actor playing four genuinely different roles in this crisis at once. It pays the same global price shock as everyone else despite barely touching Hormuz oil (Section 3). It picked up a real, if narrower, financial upside on the gas side too, mostly through timing rather than design (Section 5). It profited more than almost anyone on the oil side specifically, a producer benefiting from a crisis it isn’t fighting over supply (Section 8). And here, it’s the security guarantor whose credibility is on the line regardless of what it imports. Those four roles don’t collapse into one number or one sentence — that’s the point of splitting them across the report rather than force-fitting them into a single “the US” paragraph that would flatten what’s actually four separate stories. Three of those four are gains, tracked elsewhere in this report. This section follows the fourth one all the way through, including a side of it the report hasn’t shown yet: what playing security guarantor in a war it can’t close out is actually costing Washington, regionally and at home.
Crude sales income (bn USD/month)
STEO production × Brent. United States, Russia, Saudi Arabia, Iran, Iraq, Kuwait.
{"labels":["2025 01","2025 02","2025 03","2025 04","2025 05","2025 06","2025 07","2025 08","2025 09","2025 10","2025 11","2025 12","2026 01","2026 02","2026 03","2026 04","2026 05","2026 06","2026 07"],"datasets":[{"label":"Iran","data":[8.35510590909091,7.2873108,7.553307214285715,6.949719,6.8932483499999995,6.965864285714287,7.377639456521742,6.943101,6.893725090909092,6.902925,6.411598499999999,6.592167714285713,7.019890952380954,6.728594040000002,10.454748872727274,11.2596,8.801507763157895,6.917326363636364,7.529906739130434],"backgroundColor":"#3B6F8FCC","borderColor":"#3B6F8F","pointBackgroundColor":"#3B6F8F","pointBorderColor":"#ffffff"},{"label":"Russia","data":[22.054776477499995,18.936446760000003,20.21355199285714,18.494633083500002,18.0784928683,19.393180505714287,20.14646141739131,19.247117560000003,18.86208846545455,18.60408317173913,17.795726570999996,17.833946427285714,18.991076167380957,18.157279728000006,29.247719476363642,31.7489052375,29.71953645868421,22.668761686449034,22.974437866390893],"backgroundColor":"#6FA0BCCC","borderColor":"#6FA0BC","pointBackgroundColor":"#6FA0BC","pointBorderColor":"#ffffff"},{"label":"United States","data":[32.355435146893186,28.027719731088,30.49883180386714,27.712738321065,27.044021505965,29.270289524028577,30.224096686956536,29.10825873637,28.383813737018187,28.001547191282604,26.654278145099994,26.775060546872854,27.4702269514881,27.213109856688007,43.883098621330916,49.195222646625,45.68591659842632,35.334574136181814,35.859284882101285],"backgroundColor":"#A7C7D6CC","borderColor":"#A7C7D6","pointBackgroundColor":"#A7C7D6","pointBorderColor":"#ffffff"},{"label":"Kuwait","data":[5.9468695,5.132801520000001,5.524060500000001,5.0283261,4.97512707,5.358357142857143,5.461655478260872,5.154726500000001,5.2008872727272735,5.002119565217391,4.8613314,5.021680699999999,5.285564952380954,5.081180160000001,3.676746545454546,1.9352437500000002,1.7270883157894736,3.3818040000000003,4.414083260869564],"backgroundColor":"#DDE8EFCC","borderColor":"#DDE8EF","pointBackgroundColor":"#DDE8EF","pointBorderColor":"#ffffff"},{"label":"Iraq","data":[10.566751590909089,9.019367279999999,9.808025785714284,8.7484698,8.61156533,9.259241142857144,9.469805869565223,9.257468000000001,8.974080000000002,8.803730434782608,8.2872303,8.25959837142857,8.940037595238099,8.733278400000003,5.115473454545456,4.926075,4.317720789473685,4.918987636363636,7.114463608695652],"backgroundColor":"#1C475FCC","borderColor":"#1C475F","pointBackgroundColor":"#1C475F","pointBorderColor":"#ffffff"},{"label":"Saudi Arabia","data":[21.747849204545457,18.6935364,20.517939,18.191911500000003,18.08228915,20.790425714285718,20.260980000000004,19.146127,20.395636363636367,19.508266304347824,18.564926999999997,19.000953999999997,20.33703702380953,20.840778000000007,23.33934763636364,22.730317499999998,21.588603947368423,18.57430227272727,20.382678586956516],"backgroundColor":"#4D7FA1CC","borderColor":"#4D7FA1","pointBackgroundColor":"#4D7FA1","pointBorderColor":"#ffffff"}]}
The United States imports approximately 0.4 million barrels per day of crude from Persian Gulf producers via Hormuz — against consumption of roughly 20 million barrels per day, that’s 2 percent. By any straightforward reading of direct national interest, the US has the least at stake of any major power in a Hormuz disruption. And yet Washington has been the most publicly committed party to reopening the corridor, has run a naval blockade of Iranian ports for most of the crisis, and has now negotiated, lost, and renegotiated a settlement with Iran twice in five months. The apparent contradiction resolves the same way it always does: the relevant question isn’t what the US imports through Hormuz, but what it has built, guaranteed, and staked its credibility on since 1945.
That system is worth spelling out. The post-war international order rests on several interlocking commitments, one of the most fundamental being freedom of navigation — the principle that major maritime corridors stay open regardless of local disputes. The US Navy became the enforcer of that principle not because American ships were always the ones being protected, but because an open global trading system was the architecture of American economic and strategic primacy. Since Iran first restricted passage in late February, shipping traffic through the strait has ranged from a near-total halt to a brief reopening to, as of this writing, roughly 12–15 percent of pre-war baseline (Global Energy Flow, 19 August 2026). A principle the US has enforced by presence for seventy years has, for six months, simply not held — and Washington’s posture reads as an attempt to restore it rather than to protect any specific cargo.
The full month-by-month sequence is already laid out in the Executive Summary’s timeline, so it’s worth compressing here rather than re-running it: US-Israeli strikes on February 28 triggered Iran’s initial closure within hours. A ceasefire in April collapsed within ten days. A first US-brokered MOU, signed at Versailles in June, lasted barely a month before tanker strikes, a roughly 140-target CENTCOM strike package, and an Iranian strike on its own mediator, Oman, brought it down by mid-July. A second MOU in August lasted barely a week before Tehran’s own hardliners denounced it and the UAE, hit by stray missiles days later, suspended all trade with Iran “until further notice.” Twice, Washington negotiated a reopening; twice, the reopening didn’t hold — and both times, rather than let the corridor stay closed, the US negotiated back in. As of this update, September 8, the strait is 192 days into a closure that has never fully reversed. That’s the persistence the credibility argument above predicts, and it’s exactly what makes what happened next, on September 5, so notable.
That standing exposure turned kinetic on September 5, when Iran’s Revolutionary Guard fired ballistic missiles directly at a US Navy aircraft carrier and a guided-missile destroyer operating near the strait. Both ships evaded the incoming fire; CENTCOM reported no casualties or damage, while Iran claimed both vessels were damaged and forced to leave the area, a claim with no independent verification (Army Recognition, September 2026). The US answered within hours, striking three Iranian crude carriers — the Downy off Kharg Island and the Stark 1 near Jask, both permanently disabled, and a third tanker destroyed in the Gulf of Oman after its crew evacuated — vessels CENTCOM described as part of the same tanker fleet financing Iran’s military. Defense Secretary Pete Hegseth warned that further Iranian attacks on American ships would bring additional strikes on that fleet, and US Naval Forces Central Command’s Admiral Brad Cooper put the new arithmetic bluntly: “If you shoot at two of our ships, we will impose an even higher economic cost — taking out three of yours” (Al Jazeera, September 2026). The next day, Iran announced plans for a new “restricted maritime zone” stretching from the edge of the US naval blockade into parts of the Gulf, with any vessel entering it added to Iran’s own sanctions list — alongside separate, still-pending plans for Iran and Oman to sign new maps regulating Hormuz traffic (Middle East Eye, September 2026). Six months in, Washington is no longer defending an abstract principle of freedom of navigation at arm’s length — its own ships have now been fired on directly, and its retaliation has attached a public, escalating price to the next attempt.
None of that changes the underlying alliance argument — if anything it sharpens it. Japan and South Korea are formal US treaty allies whose defense planning has depended for decades on the assumption that Washington keeps their energy supply lines open; every closure-reopening-closure cycle tests that assumption in public, in a way seventy years of steady-state deterrence never required. Washington’s repeated re-engagement is proportionate not to America’s 2 percent direct import share, but to what happens to alliance credibility if it’s seen failing to reopen a chokepoint it has promised, twice, to reopen. But the sharpest doubts about that credibility aren’t coming from the formal treaty allies at all — they’re coming from the informal Gulf partners who never had a treaty to point to in the first place, and who are now openly reassessing what an implicit American security guarantee is actually worth.
Gulf states have said plainly, in public and to their own analysts, that they were not consulted before the February 28 strikes and had no seat at the table as a war they didn’t start reshaped their own neighborhood (Carnegie Endowment, April 2026). One widely cited assessment puts the reputational cost in blunt terms: the war has shown the US to be “an unpredictable and unreliable partner” that “cannot fully protect them” and “may even jeopardize their security with reckless acts” — with the likely response not a wholesale pivot to a rival power, but a diversification of defense relationships toward Europe, South Korea, and Australia rather than continued single-partner dependence on Washington (Brookings, June 2026). Turkey tells a related story from a different angle: Ankara had hoped this presidency would deliver a genuine reset with Washington and, by its own account, has “little to show for it” beyond a partial US withdrawal from Syria — pushing Turkey toward the same hedging-and-diversifying posture as the Gulf states, not because it wants to abandon the relationship, but because it no longer trusts it to be predictable (Brookings, June 2026).
The clearest sign of how seriously Washington is weighing this cost is what it’s reportedly considering doing about its own footprint in the region. Iranian missile and drone strikes on US bases during this war have killed 18 American service members and wounded hundreds more, and the Pentagon is said to be weighing what officials call a “once-in-a-generation” reassessment of the roughly 20 bases and 40,000 troops the US maintains across the Gulf, including Bahrain’s Fifth Fleet headquarters — with some officials reportedly open to not fully rebuilding damaged facilities rather than restoring the prior footprint, and a westward repositioning toward Jordan and Israel under active discussion (The Times of Israel, August 2026). A drawdown of that kind would read across the region as exactly the retreat Iran has spent this war trying to provoke — which is precisely why the security-guarantor role this section opened with has turned out to be the expensive one.
There’s a domestic price dimension too. Oil is priced on one global benchmark — so American consumers feel the Brent spikes and the futures-versus-dated gap at the pump regardless of how little Gulf crude the US imports directly. Two failed-then-partially-revived ceasefires in five months haven’t calmed that market; each collapse has re-shocked it. For an administration whose domestic argument rests substantially on economic performance, a recurring, self-reopening oil shock originating in a conflict it can’t close out is a standing liability, not an occasional one. That’s the consumer-side story. There’s a producer-side story too, and a more complicated one: what the same closure quietly does for US and Russian oil income.
That economic liability compounds a more basic problem: this involvement has never had durable public backing to draw on while absorbing it. A late-August Reuters/Ipsos poll found just 31 percent of Americans supporting the conflict against 63 percent opposed, with the president’s approval rating down to 33 percent from 40 percent since the fighting began (Al Jazeera, September 2026). Washington’s role in this crisis, in other words, isn’t only costly abroad — it’s disputed at home, sustained by an administration’s read of long-run alliance credibility rather than by anything resembling a domestic mandate. That’s a genuinely different kind of exposure than the 2 percent import-share figure this section opened with, and arguably a more binding constraint on how much longer this persistence can continue.
Washington’s motives have not changed. What has changed is that “why Washington acts” is no longer a question answered by one ceasefire — it’s a question Washington has now had to answer twice, and may have to answer a third time before this is over. There’s a harder question sitting behind that one, and this report doesn’t pretend to settle it: whether the credibility Washington has spent seven months defending will still be there to draw on once the shooting actually stops. The more measured assessments think the US remains, for now, “the partner of choice for most of the region” — but even that verdict comes with a condition attached, that future administrations do the work of rebuilding trust rather than assuming it snaps back on its own (Brookings, June 2026). Iran’s card, per the rest of this report, is worth less in September than it was in February. Whether the same turns out to be true of America’s is the one question this crisis hasn’t yet answered.
Read also: “The Cost of War: Hunting Mice with an Elephant” — Broad Horizon’s deeper look at what this war has cost the US militarily, in hard numbers.
Section 8 — The Cost of Holding the Card
Every instrument of coercion has a cost. The question is whether that cost falls primarily on the party applying pressure or the party absorbing it. In Hormuz’s case, the answer is more complicated than Iran’s strategic communication suggests — because the geography that gives Iran its leverage is the same geography that traps its own economic interests inside the threat it is making. Iran is the critical paradox of this whole crisis: the one country that controls the threat and cannot escape it.
Start with Iran’s own exposure. It exported approximately 2.41 million barrels of oil per day through Hormuz in 2025 — 1.69 million barrels of crude and condensate and 0.72 million barrels of refined products — almost all of it originating at Kharg Island, its main offshore loading terminal in the northern Persian Gulf. Every cargo that leaves Kharg travels south through the strait; there is no other route at meaningful scale.
The Goreh-Jask pipeline, built specifically to give Iran a Hormuz-bypassing export option, has an effective capacity of only about 300,000 barrels per day — roughly 12 percent of Iran’s normal export volume — and has barely been used since 2024. It is not a strategic alternative. It is a footnote.
The practical consequence: any effective disruption of Hormuz — mining, missile threats, harassment that raises insurance costs — also disrupts Iran’s own export revenue. A sustained closure that keeps tankers from loading at Kharg is a sustained closure of Iran’s primary state income source. (At the March 2026 Brent peak of $118, that 2.41 mb/d represents roughly $284 million in daily export value — a rough estimate, not an independently confirmed figure.)
And the export record does show that damage, once the measure used is actual cargoes loaded rather than crude pumped. A simple proxy — Iran’s crude production multiplied by the monthly Brent average — puts its income at roughly $44 billion in Jan–Jun 2025 versus $51 billion in the same months of 2026, up an estimated 16 percent. That figure is real as a production-times-price calculation, but it isn’t a revenue figure: it credits Iran with the value of oil that came out of the ground, whether or not that oil was actually loaded, insured, shipped, and paid for by a buyer — and for long stretches of 2026, much of it wasn’t. Exports held up through the crisis’s opening weeks at roughly 2.12 million barrels a day in February before sliding to about 1.15 million b/d in March.
The real collapse followed once Washington moved from threat to enforcement: a US naval blockade specifically targeting Kharg loadings, begun April 13, cut exports to an average of 228,000 b/d in the second half of that month and to just 111,000 b/d in the first half of May — roughly a twentieth of the pre-crisis rate — with the entire month of April yielding an estimated $2.9–3.2 billion in revenue, not the multi-billion-dollar monthly take the price alone would suggest (FDD, “Iranian Oil Exports Nosedive After U.S. Blockade Begins,” May 2026). Terminal loadings at Kharg fell to around 640,000 b/d in May, China’s deliveries from Iran dropped 25 percent versus April, and Kpler’s own analysts warned Iran could exhaust its accessible floating oil supply within 60 to 70 days if the pressure held (Middle East Forum, “Iran’s Oil Production and Exports Enter a Steep Decline,” May 2026). Exports partly recovered once the blockade was temporarily lifted in mid-June — Iran moved roughly 77 million barrels between June 16 and July 12, earning over $6 billion, with the month of June averaging 1.75 million b/d — only to fall back to 967,000 b/d in July once the blockade was reinstated on July 14, that month’s roughly 30 million barrels worth an estimated $2.44 billion (UANI, “July 2026 Iran Tanker Tracker,” August 2026). Kharg’s western terminal then sat idle for a 25-day stretch beginning July 18 — satellite imagery in early August showed all three of its terminals empty, an idling one analysis attributed to insurers and traders pulling back rather than physical damage — before a single tanker loaded there again on August 12, a restart The National called “more symbolic than indicative of full operational recovery,” since Kharg normally handles around 90 percent of Iran’s exports (The National, “Iran reroutes oil flow as loading resumes at Kharg Island terminal,” August 2026; Eurasia Business News, August 2026). Through the halts, Iran leaned on floating storage and ship-to-ship transfers to keep some crude moving to China even when Kharg itself couldn’t load, rebuilding to an estimated 28 million barrels held near Malaysia’s Eastern Outer Port Limits anchorage by the end of July (UANI, August 2026). None of that shows up in a production-times-price estimate, which is exactly why the 16 percent figure and the actual, repeatedly near-total export collapse it’s meant to summarize point in opposite directions: on the shipment data, not the production data, Iran’s oil income has not risen through this war — it has swung between near-total blockade and partial, tolerated recovery, a pattern of real and recurring revenue loss rather than the steady gain the proxy implies.
The cost doesn’t fall on Iran alone, either. Five of Iran’s Gulf neighbors — Saudi Arabia, Iraq, the UAE, Kuwait, and Qatar — collectively exported approximately 15 million barrels per day through Hormuz in 2025, and all of them depend on that revenue for state budgets and domestic political stability. None benefits from a prolonged closure, and their collective interest in reopening it is, in aggregate, far larger than Iran’s interest in keeping it shut. Saudi Arabia in particular is not a passive victim: it has the largest financial reserves in the region, the closest relationships with both Washington and major Asian buyers, and the only alternative export infrastructure of meaningful scale — its capacity to help facilitate a resolution is real.
That neighborhood picture is only half of it, though, because Hormuz’s biggest oil exporters are not the crisis’s biggest financial winners. Using the same production-times-price arithmetic — STEO output times the Brent monthly average, a proxy for income rather than an audited revenue figure — estimated crude income in the first half of 2026 rose approximately 31 percent for the United States ($174bn to $229bn) and 28 percent for Russia ($117bn to $151bn) against the same months of 2025 — almost entirely from the higher price rather than higher output, since neither country routes meaningful volume through Hormuz and neither carries the shipping risk the closure creates. Saudi Arabia, which does depend on the strait but also has bypass capacity, gained a more modest 8 percent ($118bn to $127bn), as the higher price was partly offset by lower output. Iraq and Kuwait, which have no bypass and took the production hit directly, lost an estimated 35 and 34 percent respectively, even at the higher price. The closure doesn’t only cost Iran and burden its Hormuz-dependent neighbors — it quietly moves revenue toward the two largest oil producers with no exposure to the strait at all, complicating the more familiar story about alliance credibility and pump prices.
The financial ledger isn’t the only one being kept, and it doesn’t point in the same direction as every other one. Independent assessments of the wider war reach mixed verdicts on who comes out ahead strategically, not just financially: China is widely read as a relative winner, positioned as a stable, trade-focused actor while Washington and Tehran fought each other. Israel inflicted serious damage on Iran’s missile forces and allied militias but without a clear political endgame to show for it — a tactical result, not a settled one. And at least one assessment goes further than this report’s own conclusion, calling Iran a “tactical winner” for preserving regime survival and its coercive tools despite the economic cost (The Media Line, August 2026). There is no single scoreboard here — analysts weighing different things call it differently, and the rest of this section makes the specific, numbers-based case for why Iran’s position has still weakened.
There’s a longer-run dimension too, operating over years rather than months: every week Hormuz stays unreliable accelerates the investment case for bypass infrastructure that wouldn’t otherwise be economically justified. Petroline exists because of 1980s Gulf War risk; Fujairah exists because of periodic Iran tension; this crisis is producing the same dynamic at a larger scale. Saudi Arabia has the motivation and resources to expand Red Sea capacity, Iraq has renewed incentive on Kirkuk-Ceyhan, the UAE is looking at Fujairah expansion, and South Korea and Japan are diversifying suppliers faster than they otherwise would have. None of that investment disappears when the crisis ends — so by sustaining the disruption long enough to motivate it, Iran is progressively eroding the strategic value of the instrument it’s using.
Beyond physical infrastructure, there’s a reliability question — a reputational cost. Iran’s oil, and Gulf oil more broadly, now carries a risk premium it didn’t carry before this crisis. Long-term supply contracts, refinery configuration decisions, and reserve policies everywhere will be recalibrated around the demonstrated willingness to use the strait as a weapon — a slow, structural shift, and a very difficult one to reverse.
Section 9 — The Card Iran Lost, and Who Picks It Up
Iran still sits on the Strait of Hormuz, and nothing about the map has changed since February. Almost everything else has. This section is about what six months of actually holding that leverage cost the country holding it — and why a threat can be worth less in August than the day it was made, even with the geography untouched.
Measured plainly: as of September 8, 2026, the strait has been in some state of closure or contested passage for 192 days; traffic ran at 6–13 vessels a day (10-day average 13) in the first week of September against a pre-war average near 110 — essentially the same level as three weeks earlier, despite a direct missile exchange with the US Navy in the interim (Al Jazeera, September 2026). Two negotiated agreements have been signed since June, and both have either collapsed outright or are running on a second, untested clock: the first one’s parallel nuclear-talks window expired August 17 with nothing to show for it, and the second was overtaken on September 5–6 by the tanker-and-missile exchange and Iran’s declaration of a unilateral “restricted maritime zone.” The effective strategic leverage window for the most exposed importers ran four to six months — that window has now closed. Japan and South Korea didn’t run out of oil the way a naive reserves calculation might have implied; they spent those months rerouting, contracting, and rationing, exactly as India did within weeks. The physical stock clock never reached zero. The political and economic clock ran out first, on schedule — and it ran out on everyone, Iran included.
Of the two Gulf states best positioned to help end this — the ones that should have been closest to Iran’s side — it has now alienated both. The UAE was never a combatant in this war; for most of the crisis it was one of the two Gulf states, alongside Saudi Arabia, with the infrastructure and diplomatic standing to help manage a way out — the Fujairah bypass pipeline, a long relationship with Washington, a direct commercial interest in a reopened strait. Six months of proximity to a conflict it didn’t start bought it a trade suspension “until further notice.” Oman fared worse, and earlier: as the one Gulf state with no Hormuz exposure at all, and therefore the cleanest incentive to broker a deal, it was the mediator Iran could least afford to alienate — and struck anyway. The August 12 MOU still routes the strait’s “future administration” through Iran-Oman negotiations, meaning Tehran is now trying to rebuild, under pressure and on a deadline, the exact channel it damaged weeks earlier. That rebuilding is still unfinished: Iran and Oman are expected to sign new joint maps regulating Hormuz traffic “in the coming days,” even as Iran unilaterally declared its own “restricted maritime zone” near the strait on September 6 — a unilateral rule announced in the same week the two sides are meant to be jointly defining one (Middle East Eye, September 2026).
The map is redrawing itself, and not in Iran’s favor
None of this plays out in a vacuum, and the six months documented in this report have consequences beyond Iran’s own balance sheet. On August 7, 2026, Saudi Arabia, Turkey, and Pakistan signed the Mecca Joint Defense Agreement, a mutual-defense pact declaring that an attack on any one of the three “shall be regarded as an attack against them all” — explicitly modelled on NATO’s Article 5, and the clearest sign yet that pressure on Saudi Arabia has accelerated exactly the regional consolidation it might have been meant to prevent (CS Monitor, August 2026). One widely discussed assessment calls Saudi Arabia the emerging “centre of gravity” of a new security architecture spanning the Sunni Muslim world, leveraging its oil economy and its position controlling both the western shore of Hormuz and the separate Bab al-Mandeb chokepoint to its south — a considerably larger role than a purely financial ledger would suggest (Al Jazeera, opinion, August 2026).
Iran’s own client network has thinned in parallel, for reasons the war has accelerated more than caused. Bashar al-Assad’s fall in Syria back in December 2024 already forced Hezbollah’s rapid withdrawal after a decade of fighting there; Iranian-aligned militia factions in Iraq have fractured further as they prioritise their own domestic survival over Tehran’s wartime agenda, and Syria’s transitional government is now backed explicitly by the US and Saudi Arabia rather than Tehran (Belfer Center, April 2026). That gives new context to a fact already in Section 4: the Kirkuk-Baniyas pipeline reviving Iraqi crude exports through Syria isn’t only a bypass-capacity data point. It’s Chevron and Gulf capital building infrastructure through two countries that sat inside Iran’s sphere of influence within the last two years and, on current evidence, increasingly don’t.
Israel
Israel’s own hoped-for role in this reshuffling is considerably less settled than Saudi Arabia’s or Turkey’s. Haifa and Tel Aviv give it real Mediterranean port capacity, and Section 4 already covers the Jordan–Aqaba–Eilat–Ashkelon corridor under discussion with Gulf states — but the most detailed outside reporting on the emerging trade-route map puts Saudi Arabia and Qatar, not Israel or Egypt, at its centre, with Mediterranean access running through Syria’s Tartus and Latakia and a UAE-operated Aqaba instead (Middle East Eye, April 2026). Egypt’s own hub ambitions remain at the “ideas floated” stage — a possible new port near Gaza or on the Egyptian coast, reportedly under UAE consideration, not a committed project. Israel’s standing with the Gulf states it would need for any hub role is also complicated by conduct that predates this war entirely: its September 2025 strike on Hamas leadership in Doha still draws a pointed regional warning, in commentary otherwise sympathetic to the anti-Iran coalition, that Israeli “adventurism will not be treated differently” than Iran’s (Al Jazeera, opinion, August 2026). And Haifa’s port traffic is competing with the basic fact of sitting inside an active conflict zone — a different problem than Saudi Arabia’s, and one that doesn’t resolve just because the strait eventually reopens.
Iran’s own response to its narrowing circle of regional friends is to lean east, and the evidence suggests that lean isn’t landing the way Tehran would like. Despite a public-relations effort to present Russia and China as strategic partners, one detailed assessment finds the interest isn’t reciprocal in practice: Russia’s own defence-industrial capacity is stretched thin by its war in Ukraine and increasingly reliant on North Korea rather than Iran for supply, while China maintains a decades-old policy against arming sanctioned states and treats Iran as too high-risk for the deep investment Tehran is seeking (Washington Institute, December 2025). That’s a more precise finding than “Iran becomes dependent on Russia or China” — the evidence points closer to Iran ending up without full backing from either direction: isolated from the Gulf and the West on the numbers this section has already shown, and receiving tactical cooperation rather than the comprehensive backing it’s actually asking for from the two capitals it has left to ask.
China and Russia
China and Russia are, by most accounts, the two actors that have gained the most from this war overall — for reasons distinct from Iran’s own income figures in Section 8 thus both in financial and geopolitical aspects. China has kept roughly 11 million barrels of Iranian crude a year flowing eastward through direct diplomacy, while its factories gain a competitive edge as Western input costs rise faster than its own (PIIE, March 2026). Russia’s gains are more straightforwardly financial — the same oil-price spike documented in Section 8 plausibly adds tens of billions of dollars to a war budget that needed it, alongside quieter support to Iran in the form of satellite intelligence on US ship and troop movements (PIIE, March 2026).
One strand of analysis goes further, arguing this war has damaged a US grand-strategy doctrine that survived every administration since Nixon — keeping Moscow and Beijing apart rather than letting them consolidate against Washington together — and that this failure, not the financial ledger, is why some assessments name the US as this war’s biggest strategic loser even while its own oil producers post a real income gain (Toda Peace Institute, March 2026). That’s a genuinely contested read, not this report’s own verdict — Section 7 already showed the US gaining financially and losing regional standing at the same time; this is the same tension restated at the level of great-power strategy rather than Gulf politics.
Put alongside Section 7’s account of Washington’s own eroding position, a fuller picture emerges than any single section provides. This war is producing a regional and great-power realignment, not just a cost-and-benefit ledger: Saudi Arabia and Turkey are consolidating into a new formal security bloc; Iran’s client network in Syria and Iraq is thinning while its own eastward pivot fails to fully land; China and Russia are the parties most analysts credit with the clearest strategic gains; Israel’s own path to a comparable gain is real but the least assured of the group, and this report doesn’t have the evidence to call it either way; and the US, the security guarantor that opened Section 7’s parallel argument, is finding that the region it fought over trusts it less at the end than it did in February — a cost some analysts weigh as heavier than the financial gain documented in Section 8.
Iran
There’s a bill at home, too. Iran produces roughly 105 million liters of gasoline a day against domestic demand of about 135 million liters — a shortfall that predates this crisis and that six months of war, strikes, and export disruption haven’t helped. Roughly $100 billion in Iranian assets remain frozen abroad, untouched since February. Parliament Speaker Ghalibaf described the strategy in terms that read, six months on, less like leverage and more like a warning: “In a region where we cannot sell oil, no one will sell oil” — not a plan to win, but a plan to make everyone lose together, on the theory that Iran can absorb losing slightly less badly than its neighbors can. The neighbors have absorbed real losses too — Gulf oil exporters lost an estimated $2 billion a day in the opening weeks, roughly $1.1 billion a day since (Baker Institute) — and Iran’s own financial ledger, corrected for what Section 8 shows about its actual export record, is not the clean win a production-based estimate once suggested: a naval blockade that has repeatedly cut Iran’s exports to a tenth or less of their pre-war rate for weeks at a stretch — most severely in April–May, and again for 25 days in July–August — is a real and recurring loss of state income, not a hidden gain. On top of that loss, Iran has lost something that doesn’t show up on any revenue chart at all: the relationships, routes, and reputational assumptions that determine what a barrel of Gulf oil is worth to a buyer once the war is over. That loss shows up in an Emirati trade suspension in month six, in Tehran hardliners calling their own government’s second ceasefire “a strategic mistake” the week it was signed, and in every importing country’s now-permanent hedge against relying on this route again.
Why does the card depreciate at all, if Iran still physically controls the strait? Because a geographic chokepoint is a peculiar kind of leverage — real the instant it’s asserted, its value eroding with every day it stays asserted, in a way that has nothing to do with military strength and everything to do with what the other side does while it waits. A buyer who has actually rerouted a cargo, actually qualified a new supplier, actually built the paperwork and shipping relationships to buy differently, doesn’t unwind that the day the strait reopens. Six months of disruption has quietly converted a stack of one-off workarounds into permanent hedges — cheaper insurance next time, existing contracts to fall back on, a demonstrated alternative on file. Iran can still close the strait tomorrow. It can no longer close it onto a market that hasn’t already rehearsed a way around it.
None of this means Iran’s position is empty: the strait is still open only on Iran’s terms, at a fraction of normal traffic, not anyone else’s; two American presidents’ worth of attention, a standing naval blockade, and now a direct missile exchange with the US Navy are not the record of a threat the world has learned to ignore. The card is real — that was always going to be true. But a card that’s still real in September is not the same card it was in February. It’s been played, folded, reshuffled, and played again, twice, and each round has left Iran with a smaller circle of neighbors willing to sit across the table, a domestic fuel shortage no ceasefire fixes, and a global market pricing in permanent risk rather than a one-time crisis premium. Iran controls the strait. It no longer fully controls what holding it costs.
Iran holds the card. It has held it for 192 days, through two ceasefires, two collapses, and a direct exchange of fire with the US Navy, and will likely go on holding it for some time yet. What six months have shown is that holding the card and winning with it are not the same thing — and that the gap between them, for Iran, has been widening since almost the first week.
There’s a broader lesson sitting underneath this specific case, worth naming directly. The leverage in this report was never really about controlling a resource — it was about occupying one link in a chain that other people couldn’t easily route around. Iran didn’t gain power by needing nothing from the world; if anything, it has less of that than most of its neighbors. It gained six months of attention by sitting on a stretch of water everyone else still had to use. The countries that ended this crisis ahead of it — the ones with spare capacity, alternative supply, or simply no exposure at all — didn’t get there by being self-sufficient either. On this evidence, real strategic position looks less like owning the whole supply chain and more like being the one part of it nobody else can easily replace. That’s a narrower, harder thing to hold onto than it sounds — as the rest of this section has shown.
Section 10 — Closing Remarks: A Card Game With No Winners at the Table
This report has used a deliberate metaphor throughout: Iran holds a card, and holding it and winning with it turned out not to be the same thing. A card game assumes rules, and it assumes winners — even relative ones, players who end up ahead of where they started. Look at everyone actually sitting at this table for six-plus months, though, and no one at it quite qualifies. The two actors who doubled down hardest, the United States and Iran, both come out of this weaker than they went in, on each country’s own terms as much as anyone else’s. The parties usually described as this war’s winners were, for the most part, never really playing at all.
The two who doubled down
The United States’ cost is real but disputed by roughly a 30-fold range — the Pentagon told Congress $25–29 billion through mid-May 2026 (NPR, April 2026), while independent estimates run from Moody’s $132 billion to Harvard’s Bilmes projecting past $1 trillion (Al Jazeera, April 2026) — a spread wide enough that even the low end isn’t free, and the high end would rival the roughly $840 billion the US spends on its entire military in a year (CRS, April 2026). That cost lands on top of the trust deficit Section 7 already tracked with Gulf states and Turkey, and two further ruptures this war didn’t cause but sits alongside: Washington’s pressure campaign over Greenland pushed Denmark to name the US a national-security threat for the first time in its history (Wikipedia; CNN, January 2026), and its approach to ending the Russia-Ukraine war has allies now aiming merely “to keep the damage of the transition to a minimum” rather than expecting coordinated strategy (Carnegie Endowment, July 2026). Three separate strains landing on the same governments in the same eighteen months don’t refill trust on the strength of one ceasefire holding.
Iran’s version costs it differently but not, on the evidence, less. Sections 8 and 9 already tallied the financial exposure and the erosion of regional standing; what they didn’t cover is the domestic price. Iranian human-rights monitors recorded at least 82 executions in August 2026 alone, tied explicitly by the reporting to “mounting political, economic, and social pressure” as the rial collapsed past 2.8 million to the dollar (NCRI, September 2026), while separate coverage frames US sanctions and the naval blockade as squeezing an already-cracking economy hard enough to reignite the protests the government then suppresses (Fortune, August 2026). And the backing Iran hoped leaning east would buy hasn’t landed (Section 9): money lost, standing lost, a population absorbing the pressure of both — for a Russia-China alignment that remains tactical, not comprehensive.
The winners were mostly never at the table
The closest things to winners, by contrast, are countries that mostly declined to play at all — China and Russia, whose gains Sections 8 and 9 already quantified – collected them without risking a chip of their own. Even the harsher read of that outcome — that Washington let two rivals it had spent over five decades keeping apart, since Nixon’s 1972 opening to China, not a policy anyone has called a mistake, draw closer together instead — is a cost this report’s dollar ledger doesn’t capture at all. That’s the sharper version of the card-game metaphor this report opened with: the pot went to whoever stayed close enough to the table to collect it, not to whoever played hardest.
On Strategic Autonomy
A separate topic – Strategic Autonomy in times of war and Supply Chain disruptions, makes the underlying case explicit: the instinct to secure yourself by owning the thing you depend on — the chokepoint, the oil field, the factory — consistently overestimates how much ownership actually protects you. Iran owns its half of Hormuz outright, more completely than almost any country owns any strategic asset anywhere, and six months of holding it produced a smaller circle of trading partners. The countries this report finds better positioned instead — Saudi Arabia with its bypass capacity and diversified relationships, China with its diplomatic flexibility — got there by occupying a place in the network other people still needed.
A related Broad Horizon piece, “The Geographical Pivot of Constraints“, reaches a version of the same conclusion from further back — tracing the idea from Mackinder’s territorial “Heartland” theory to a world organized instead around constraint: power sitting not with those who hold the most ground, but with those who occupy the pressure points a network has to pass through. Put plainly, in the terms this report’s own numbers support: a good, stable position inside a supply chain — trusted, needed, hard to route around — has mattered more here than controlling any single link in it by force. That’s the through-line connecting this report many other geopolitical topics.
If this actually ends: a genuinely open question, not a forecast
Everything above rests on evidence already gathered. What follows does not, and should not be read the same way. Imagine, for a moment, a world where Hormuz reopens fully, the wider Middle East settles into something durable, and the Russia-Ukraine war ends in a settlement eventually negotiated. Even the EU’s own energy commissioner rejects the premise that this simply resets the board: “even if that peace is here tomorrow, still we will not go back to normal in the foreseeable future” (Euronews, April 2026). On the specific question of whether Russian gas could return to European markets, the available evidence points toward no, not eventually: the EU has already cut Russian gas from 45 percent of imports to roughly 10 percent, is legislating a path to zero, and analysts describe reverting to it as recreating a dependency Europe spent years and real political capital dismantling — not a live option waiting on peace (Bruegel, April 2026).
Whether Qatari LNG could regain the European share it lost is a genuinely open question this report can’t answer either way — nothing in the available analysis speaks to it directly.
Japan, South Korea, and China aren’t behaving as though they’re waiting out a resolution: Japan has committed roughly $10 billion to regional strategic stockpiling, South Korea is discussing a 30 to 40 million barrel reserve expansion, and China is funding new pipeline and storage capacity under its current five-year plan — durable de-risking, on the reporting available, rather than a bridge back to how things were (Al Jazeera, September 2026).
Saudi Arabia, the UAE, Kuwait, and Canada don’t need peace to keep building the alternative-supplier role this report has already tracked them growing into: ADNOC is already expanding crude storage in India. India is weighing reserves at the UAE’s Fujairah port, and Canada is named alongside Azerbaijan and Algeria among the EU’s new gas sources today.
If there’s a single honest answer buried in all of that, it’s the same one the rest of this report already reached from a different direction: the positions being rebuilt right now, card by card, are unlikely to fold back into what existed before February — whatever eventually happens to the strait itself.
—
Appendices
Supplementary tables that go deeper than a section’s own narrative needs — the place new data goes from here on, instead of stacking another table into a section that already has one.
Reserves
Referenced in Section 6. Proven oil reserves against current annual production — a long-run, total-self-sufficiency question, not the strategic-reserve-days question the rest of Section 6 covers.
| Country | Proven oil reserves | Oil production | Reserves-to-production ratio |
|---|---|---|---|
| Iran | 208.6 billion barrels | 4.8 million b/d | ~120 years |
| Iraq | 145.0 billion barrels | 4.5 million b/d | ~88 years |
| Saudi Arabia | 267.2 billion barrels | 11.2 million b/d | ~65 years |
| Russia | 80.0 billion barrels | 10.5 million b/d | ~21 years |
| China | 28.2 billion barrels | 5.4 million b/d | ~14 years |
| India | 5.0 billion barrels | 1.0 million b/d | ~14 years |
| United States | 83.7 billion barrels | 23.6 million b/d | ~10 years |
| Japan | 0.04 billion barrels | 0.1 million b/d | ~1 year |
| South Korea | negligible recognized reserves | 0.1 million b/d | near zero |
(Worldometers, “Oil Reserves by Country”(https://www.worldometers.info/oil/oil-reserves-by-country/) and “Oil Production by Country”(https://www.worldometers.info/oil/oil-production-by-country/), 2025/2026 data. Oil only — gas reserves run on a separate accounting and aren’t part of this table. Production here is total liquids, not crude alone, which is why the US and China figures differ from the crude-only production cited in Section 2 — same countries, different metric.)
Dependency & Imports
Referenced in Section 4. Bypass capacity measured against each country’s own total oil exports — not the global 17–26 percent figure, which is a strait-wide average and answers a different question. VLCC, train, and truck figures scale the Hormuz-dependent residual volume only, using a 2.09-million-barrel VLCC (derived from this report’s own Section 1 baseline, 20.9 mb/d ≈ 10 VLCC/day), a 70,000-barrel 100-car train (Section 4), and a 200-barrel tanker truck (standard capacity, not separately sourced).
| Country | Scenario | Own total exports (b/d) | Bypass (b/d) | Bypass % | Hormuz-dependent residual (b/d) | Residual % | Residual, VLCC/day | Residual, trains/day | Residual, trucks/day |
|---|---|---|---|---|---|---|---|---|---|
| Saudi Arabia | actual, March 2026 average | 7,000,000 | 2,900,000 | 41% | 4,100,000 | 59% | 1.96 | 59 | 20,500 |
| Saudi Arabia | actual, peak week (mid-March 2026) | 7,000,000 | 4,000,000 | 57% | 3,000,000 | 43% | 1.44 | 43 | 15,000 |
| Saudi Arabia | theoretical ceiling (Petroline run flat for exports) | 7,000,000 | 5,800,000 | 83% | 1,200,000 | 17% | 0.57 | 17 | 6,000 |
| UAE | actual, reported (July 2026) | 3,460,000 | 2,280,000 | 66% | 950,000 | 27% | 0.45 | 14 | 4,750 |
| Iraq | at capacity ceiling (Kirkuk-Ceyhan already maxed) | 3,400,000 | 225,000 | 7% | 3,175,000 | 93% | 1.52 | 45 | 15,875 |
| Iran | effective — Goreh-Jask barely operational | ~620,000 (derived, not directly reported) | ~0 | 0% | ~620,000 | 100% | 0.30 | 9 | 3,100 |
| Kuwait | no bypass route exists | ~2,700,000 (production used as a proxy — no verified export-specific figure) | 0 | 0% | ~2,700,000 | 100% | 1.29 | 39 | 13,500 |
(Saudi Arabia: Baird Maritime(https://www.bairdmaritime.com/shipping/ports/crude-exports-from-saudis-yanbu-port-surged-to-near-40m-bpd-last-week), citing Saudi export data, March 2026; Fortune, “Saudi pipeline to bypass Hormuz hits 7 million barrel goal”(https://fortune.com/2026/03/28/saudi-arabia-east-west-oil-pipeline-strait-hormuz-bypass-7-million-barrels-yanbu-red-sea/), March 2026. UAE: The National, “UAE’s Hormuz oil exports more than halve in July as shipments bypass strait”(https://www.thenationalnews.com/business/energy/2026/08/03/uaes-hormuz-oil-exports-more-than-halve-in-july-as-tankers-avoid-route/), August 2026. Iraq: figures as already cited in Section 4. Iran and Kuwait figures are derived estimates, flagged above as weaker than the directly-reported Saudi and UAE numbers — worth firming up before relying on them further.)
Gas
Comparison chart of Gas throughput in different years – though comparison is not equally comparable.
LNG through Strait of Hormuz (Bcf/d)
LNG via Hormuz: 2024, 1H2025, and 1Q2026 (billion cubic feet per day).
{"labels":["2024","1H2025","1Q2026"],"datasets":[{"label":"Bcf\/d","data":[10.5,11.4,7.3],"backgroundColor":"#BD0104FF","borderColor":"#BD0104FF","pointBackgroundColor":"#BD0104FF","pointBorderColor":"#ffffff"}]}
Sources
- EIA World Oil Transit Chokepoints (Table 3, 1H2025)
- EIA Today in Energy — Brent price (June 2025)
- EIA Today in Energy — Petroline capacity (June 2025)
- EIA Today in Energy — strategic inventories (April 2026)
- EIA, “About one-fifth of global LNG trade flows through the Strait of Hormuz” (2025)
- IEA Strait of Hormuz 2026 Factsheet (Kpler data, 2025)
- IEA Middle East and Global Energy Markets
- IEA Oil Market Report (May 2026)
- IEA coordinated release confirmation (March 2026)
- Columbia University CGEP, “Where China Gets Its Oil” (2025)
- The Media Line, “The Unfinished Iran War: Are There Any Winners?” (August 2026)
- Fortune, “Analysts expected oil to surge above $200 but China has quietly…” (June 2026)
- Newsweek, “China Presses Iran to Reopen Strait of Hormuz” (April 2026)
- India-Briefing, India crude oil tracker and diversification strategy (April 2026)
- S&P Global/METI, Japanese refiners’ Middle East dependency (August 2025)
- S&P Global, South Korea reserve release (March 2026)
- Korea Herald (April 2026)
- SolAbility, Iran War 2026 marginal cost model (August 2026)
- Global Energy Flow, Hormuz live status (August 19, 2026)
- Hormuz Strait Monitor, Crisis Timeline
- Wikipedia, “2026 Strait of Hormuz crisis”
- CBS News (August 17, 2026)
- NPR, Iran toll and ship-ban plan
- Al Jazeera (August 5, 2026)
- The Week (August 19, 2026)
- Iran International (July 2026)
- Baker Institute, “Losing Hormuz: The Costs of War for Gulf Oil Exporters”
- EIA, crude oil exports by destination (PETMOVEEXPC, May 2026 latest month, released 31 Jul 2026)
- EIA Short-Term Energy Outlook, Table 3d (August 2026, crude production by producer)
- EIA, US crude oil first purchase price (F000000, May 2026 latest, released 3 Aug 2026)
- EIA, “International LNG prices rise amid Strait of Hormuz closure” (April 2026)
- Kpler, “Global LNG and natural gas prices surge as US and Iran resume hot war” (July 2026)
- Chatham House, “Even Hormuz reopening will not resolve Europe’s key energy vulnerability” (June 2026)
- Oilprice.com, “Norway Pumps Near Capacity as Spare Output Buffer Disappears” (2026)
- Middle East Forum, “Iran’s Gas Wealth and the Limits of Export Capacity” (2026)
- Wikipedia, “2026 Iranian strikes on Qatar”
- Free Press Journal, “Asia Dominates Qatar’s LNG Exports In 2025 As China & India Lead Demand” (2025 data)
- Bruegel, “How Europe should respond to the Iran gas shock — and how it shouldn’t” (2026) · Euronews, “Which EU countries are most exposed to the LNG supply disruption?” (March 2026)
- La Finance Pour Tous, French fuel-price impact (April 2026)
- ANWB, Dutch petrol price tracker (August 2026)
- Topgear.nl, Dutch record petrol price (May 2026)
- Fuel Prices EU, European petrol price tracker (August 2026)
- European Commission, “Electric car sales surge as high oil prices drive shift away from fossil fuels” (June 2026)
- Gas Outlook, “As the Iran war intensifies, South Korea’s renewables shift accelerates” (2026)
- Global Energy Monitor, “South Korea seeks to triple renewables as fossil fuel power import bill heads for $25 billion” (2026)
- Euronews, “Clean energy saved EU €51 billion in 2025 by cutting fossil fuel imports” (May 2026)
- Argus Media, “Saudi East-West pipeline maxed out on Hormuz closure” (2026)
- Gulf Business, “New UAE pipeline bypassing Hormuz now 50% complete, ADNOC CEO says” (May 2026)
- Cryptobriefing, “Iraq to triple crude oil exports via Ceyhan pipeline” (June 2026, citing Bloomberg)
- EIA, “U.S. LNG exports rose 23% in the first half of 2026” (September 2026)
- China Daily, “China produces record amount of crude oil” (2026)
- Pew Research Center, “What to know about US oil production and consumption” (July 2026)
- Worldometers, “Oil Reserves by Country”
- Worldometers, “Oil Production by Country”
- Baird Maritime, “Crude exports from Saudi’s Yanbu port surged to near 4.0m bpd last week” (March 2026)
- Fortune, “Saudi pipeline to bypass Hormuz hits 7 million barrel goal” (March 2026)
- The National, “UAE’s Hormuz oil exports more than halve in July as shipments bypass strait” (August 2026)
- Pipeline Technology Journal, “Kuwait Explores New Pipeline Routes with Arab Neighbours Amid Strait of Hormuz Closure” (June 2026)
- Middle East Eye, “From Syria to UAE, the race to bypass Strait of Hormuz is on” (July 2026)
- Israel Hayom, “Israel, Gulf states pursue secret energy corridor to bypass Hormuz” (August 2026)
- The National, “Why new pipelines cannot make Strait of Hormuz worthless” (September 2026)
- World Bank, “Fertilizer prices surge as Strait of Hormuz disruptions tighten supplies” (2026)
- CSIS, “Beyond Russian Gas: Trade-Offs in EU Liquefied Natural Gas Diversification” (May 2026)
