Influx of Asylum Seekers in The Netherlands – June 2025
Monthly report for the Asylum Influx in The Netherlands.
Key Takeaways
- The amount of first applications this month is higher than last month
- The most Asylum Seekers came from Eritrea (506)
- About 48% of the total came from Sub-saharan Africa (Sahel)
- The global trend is lower this year compared to last year
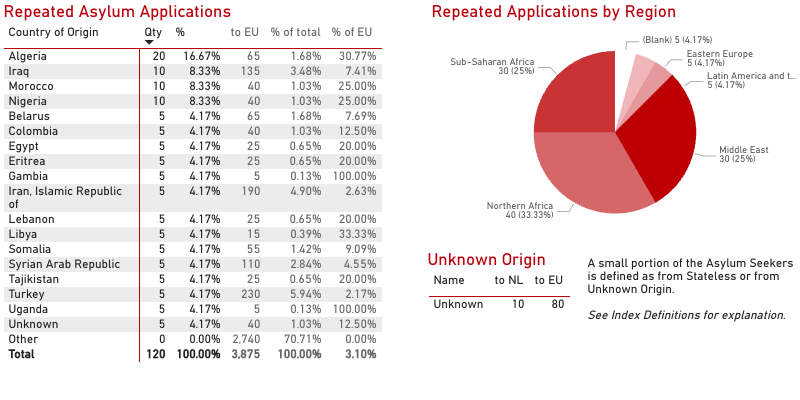
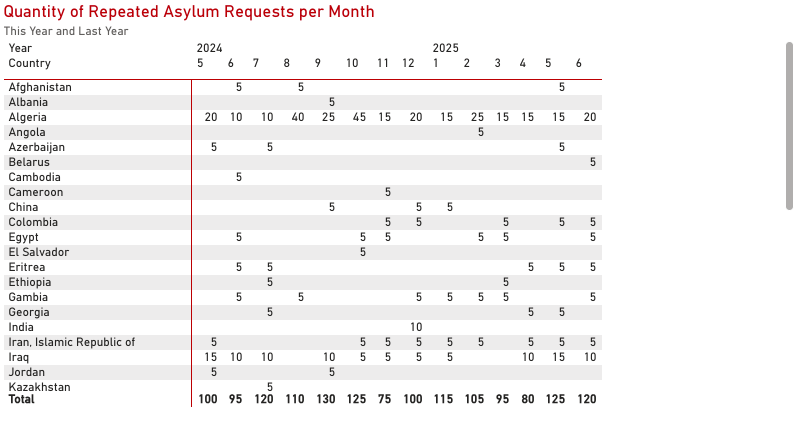
- The amount of repeated applications this month is 120
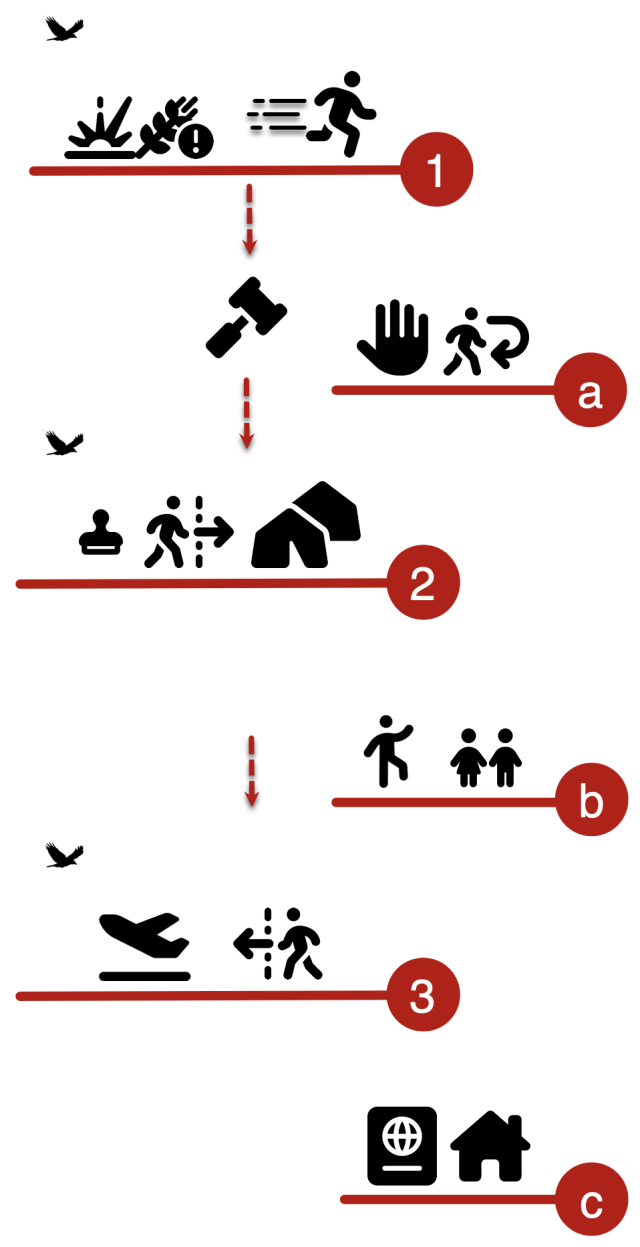
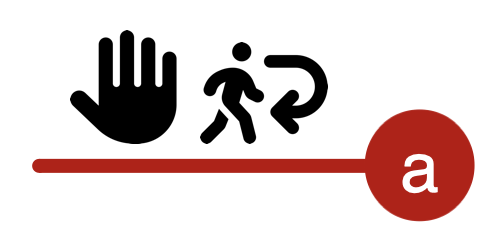
The asylum process begins with an asylum-seeker (1) — someone seeking international protection but whose application has not yet been decided. Once their application is reviewed and approved, they receive protection status (2), which may lead to eventual integration or, ideally, return (3) to their home country when conditions allow.
Alongside the main process, there are several pivotal pathways:
- Sequential applications (a): Appeals or subsequent claims after an initial rejection.
- Family reunification (b): Facilitating the unification of families separated by conflict or migration.
- Naturalization (c): A pathway to citizenship for those who establish long-term residence and integration.
For those unable to return due to insurmountable obstacles, yet living without legal status, we must acknowledge the existence of a challenging category: irregular stay (x). These individuals require humane solutions when return is not an option.
Learn More: For a comprehensive overview of the asylum process, pathways, and global practices, visit our Asylum Migration Overview.Accordion content
For clarity the Tables show the 10 countries with the highest amounts and sum the rest into “others”. The data per period per country is available in a separate dataset.
New Asylum Applications
The information on this page is related to Asylum Seekers that made a first request for asylum in this period. These persons can be called “New” or “Influx”.
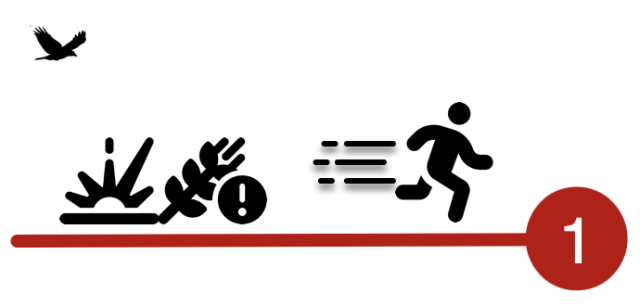
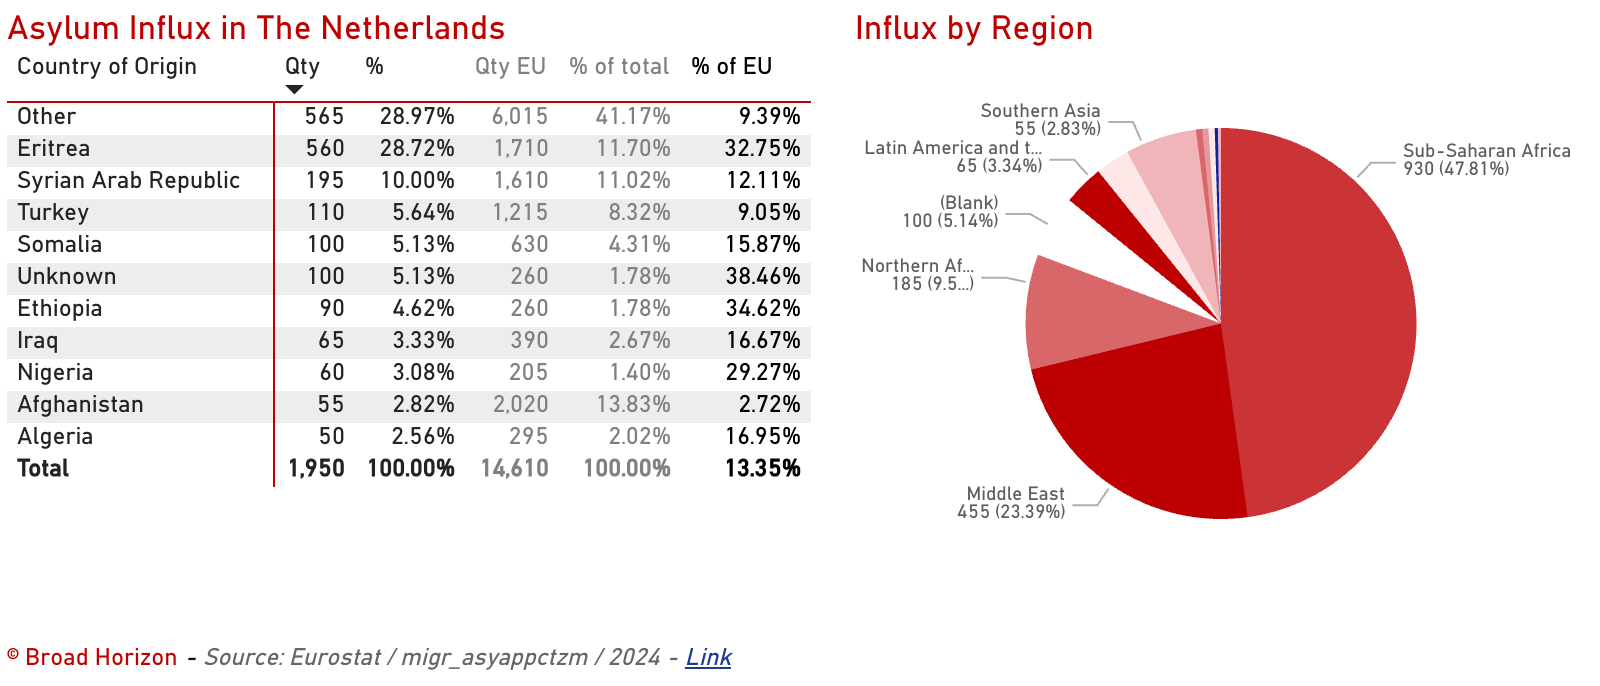
Table: Asylum Influx: shows the top 10 list of countries with the highest number of asylum seekers. The rest is summarized as “Other”.
The table shows the number of asylum seekers that made the first request in this month. All numbers are rounded up to the nearest 5 (meaning 1 –> 5, 7 –> 10).
Influx by Region: The Pie Chart groups the countries of origin in their geopolitical regions (item).
This might give insight on interpretating the geopolitical context and issues.
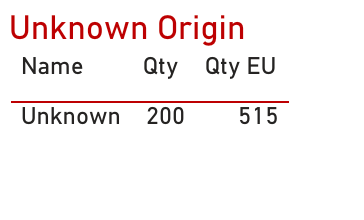
A small portion of the Asylum Seekers is defined as from Stateless or from Unknown Origin.
See Index Definitions for explanation.
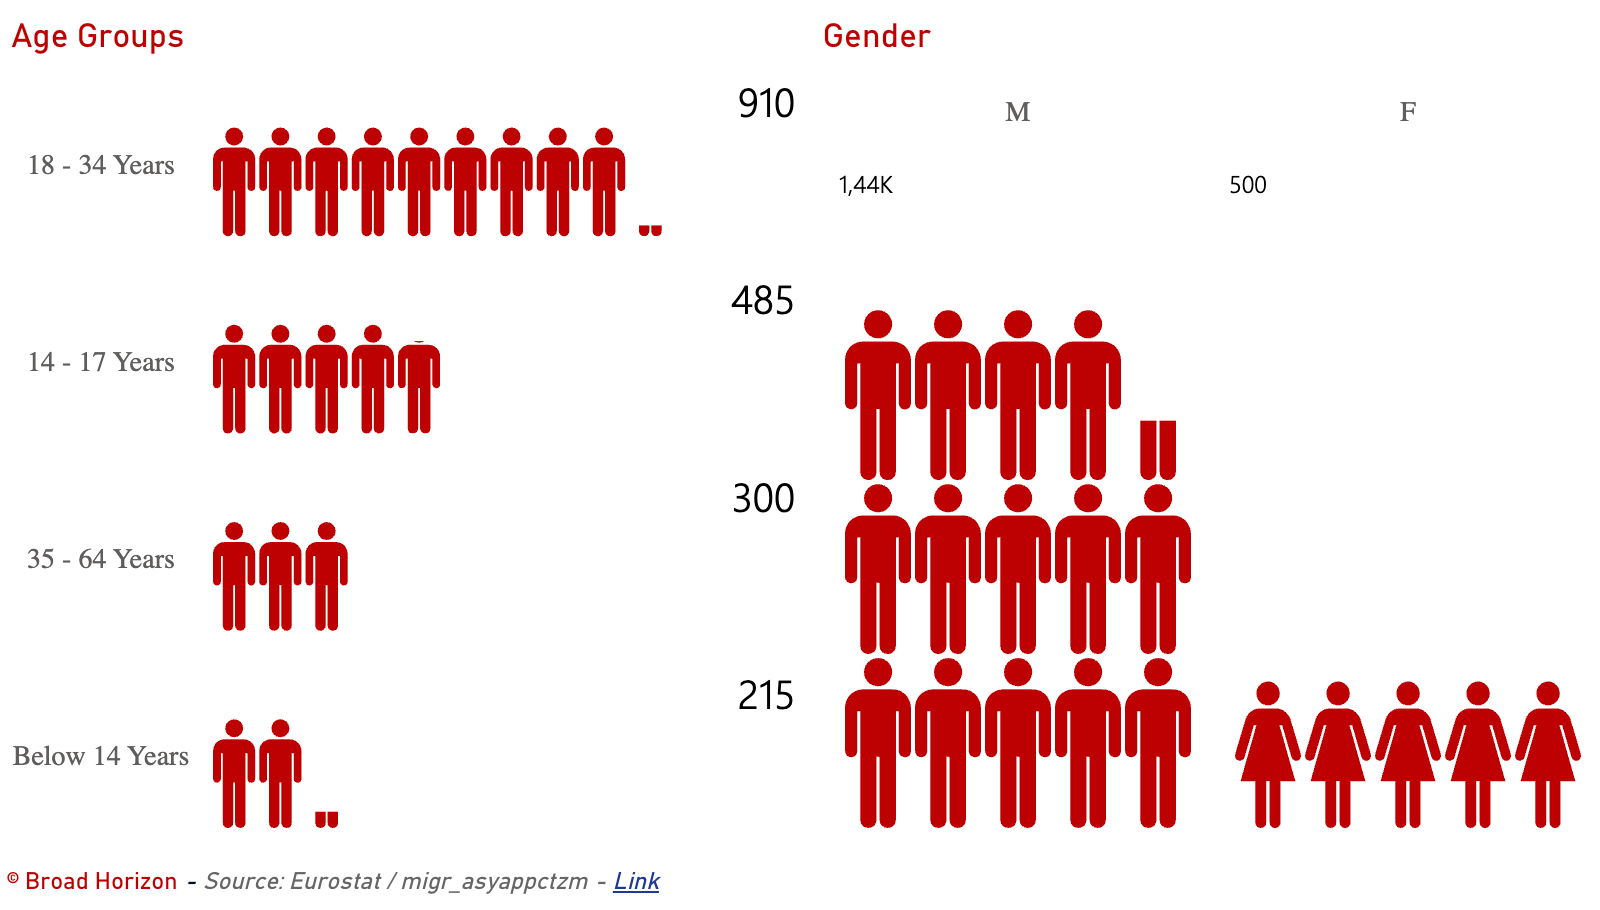
DEMOGRAPHICS
Migration Autorities keep track of demographic data such as Age and Gender (M/F). This gives an idea what kind of people are seeking asylum. Data such as cultural background, religion, education or previous jobs are mostly not recorded. That would be helpful for better analysis.
Asylum Influx Trends
This page gives information on the actual numbers over longer periods. Such as asylum influx per month and per year. As wel as trend lines over longer periods. This gives a better understanding on asylum trends, for example if influx is stable, higher or lower and helps understanding reason and impact. Trend figures are also used to make future predictions.
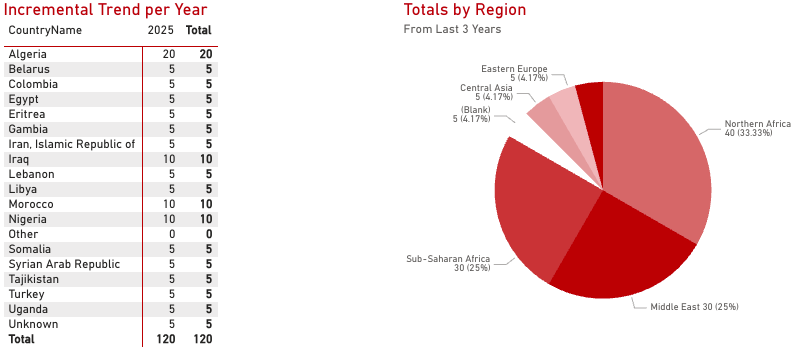
ACTUALS PER YEAR
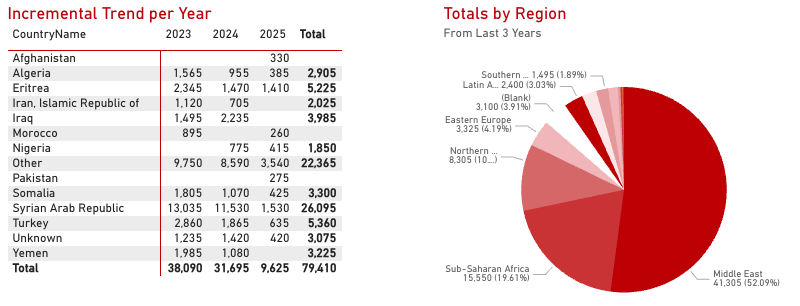
Table: Incremental Asylum Influx per Year – shows the top 10 list of countries with the highest number of asylum seekers per year. The rest is summarized as “Other”.
Totals by Region: The Pie Chart groups the countries of origin in their geopolitical regions.
This might give insight on interpretating the geopolitical context and issues.
ACTUALS PER MONTH
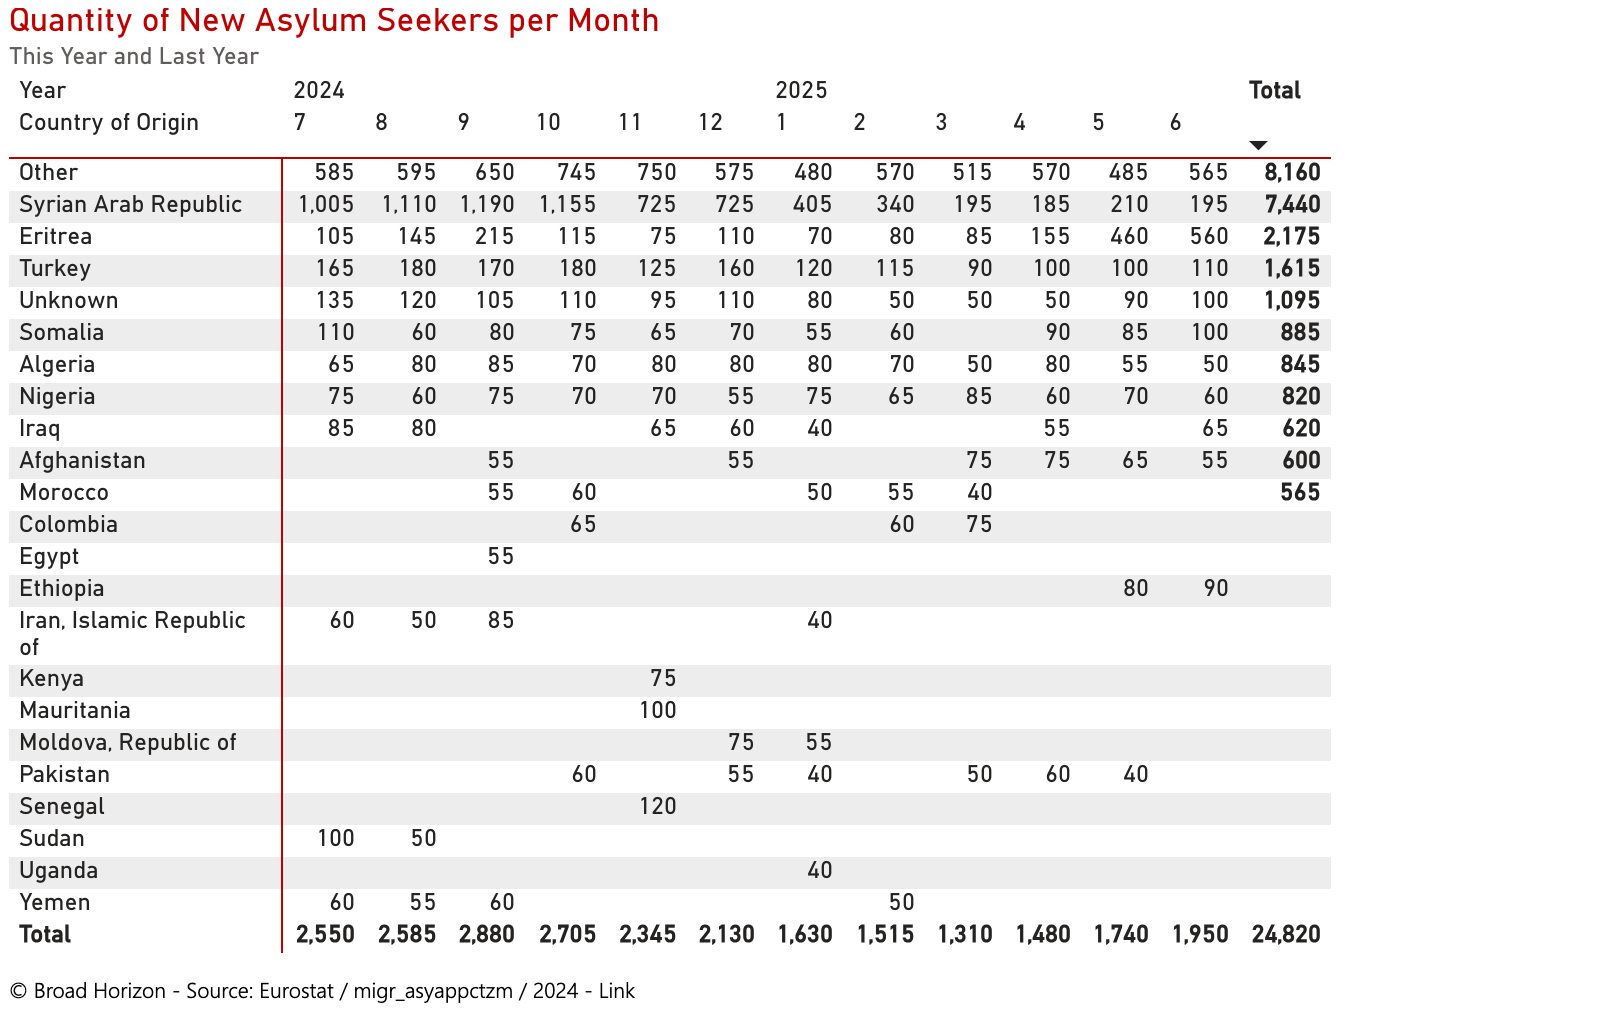
Overview of the quantity of sequential asylum requests every month over the past year (YTD)
TRENDS PER YEAR
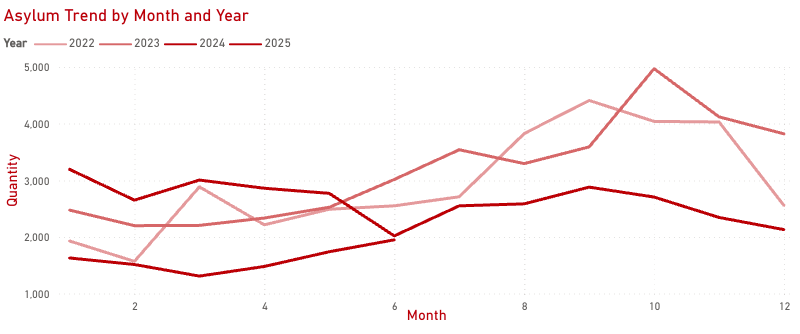
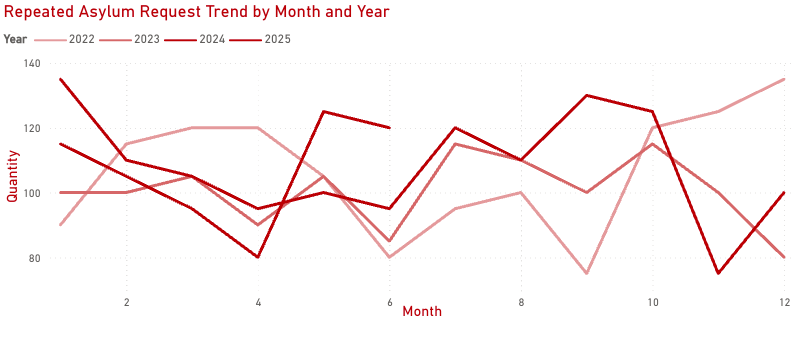
The Graph shows the progression of the quantity of new Asylum requests per month. This year compared with the last two years. This gives a better comparisation over a longer period of time.
TRENDS RELATED TO POPULATION
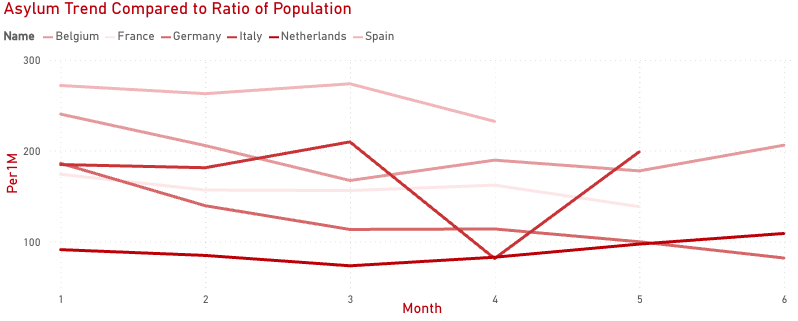
This Graph shows the ratio between the amount of new Asylum Seekers per Month compared to the Countries population. This makes it possible to compare between countries based on the same measure. Example: In Sept. 2024 The Netherlands had 2.880 new applications, which counts as a ratio of 160 per 1 Million inhabitants.
Repeated Asylum Applications
The information on this page applies to asylum seekers whose initial application was rejected and who have submitted a new asylum application during this period and have appealed the outcome.
ACTUALS THIS PERIOD
ACTUALS PER YEAR
ACTUALS PER MONTH
TRENDS BY YEAR AND MONTH
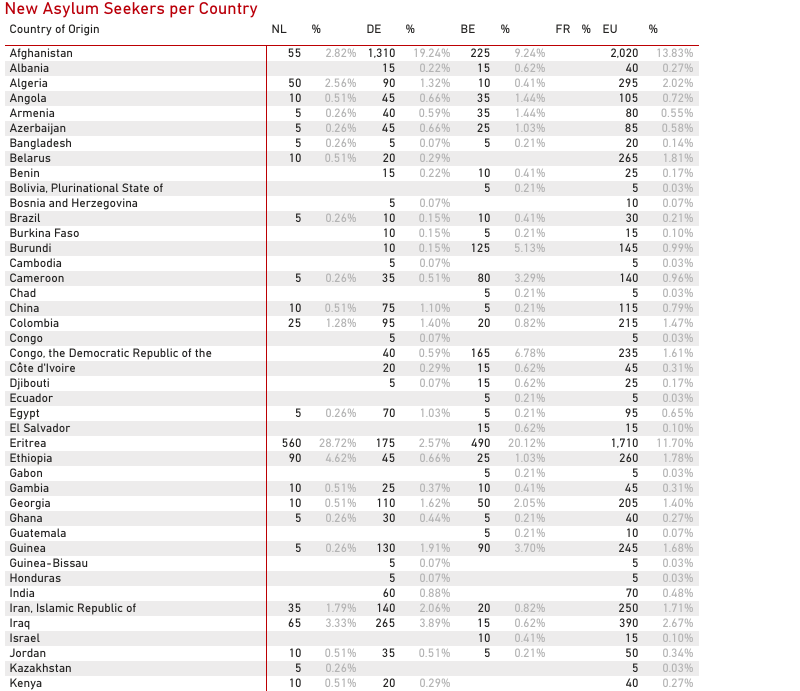
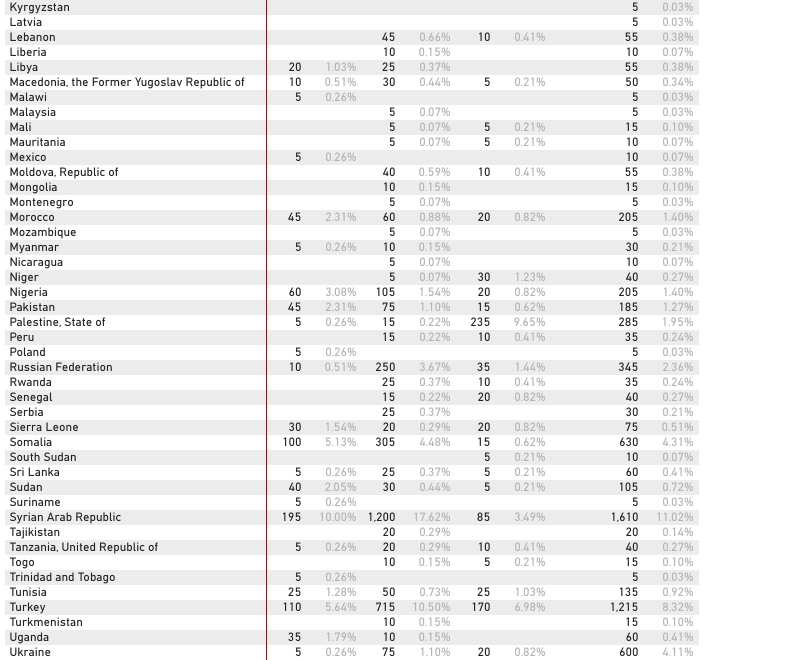
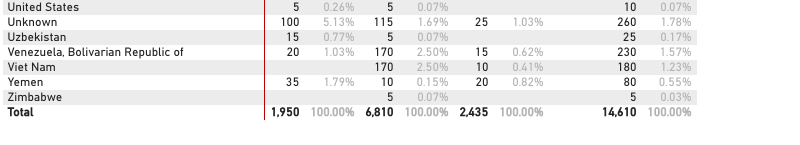
Appendix I
This Table contains the new Asylum Applications from all Countries of Origin to the Reporting Countries listed.
Clarification
The data is taken from the Eurostat Dataset and enriched with related information such as Date Periods, Countries etc.
- All Data is rounded to the nearest 5
The methodology of creating this report will be explained in a separate article.
Disclaimer
Although our reports are compiled with care, a data issue or statistical error may occur. We are not liable for any incorrect data.
If you see something that is incorrect or have an idea for improvement or other feedback, please let us know trough the Contact Form or Chat.
Feel free to leave feedback. Inquire information, ask questions or otherwise.
Support Our Work

Asylum Trend Report
Table of Contents
Related in this Period
Related Country Reports
[icon name=”triangle-exclamation” prefix=”fas”] Data Accuracy Notice
EU Asylum Quantities are Not Complete Yet due the fact that Reporting Countries may update Data until 2 Months after the end of the Reporting Period.
The Data may Change a bit over time.
Support Our Work